Looking to build out your prospect database but unsure whether to use data enrichment or web scraping? These two approaches are often confused, yet they serve very different needs.
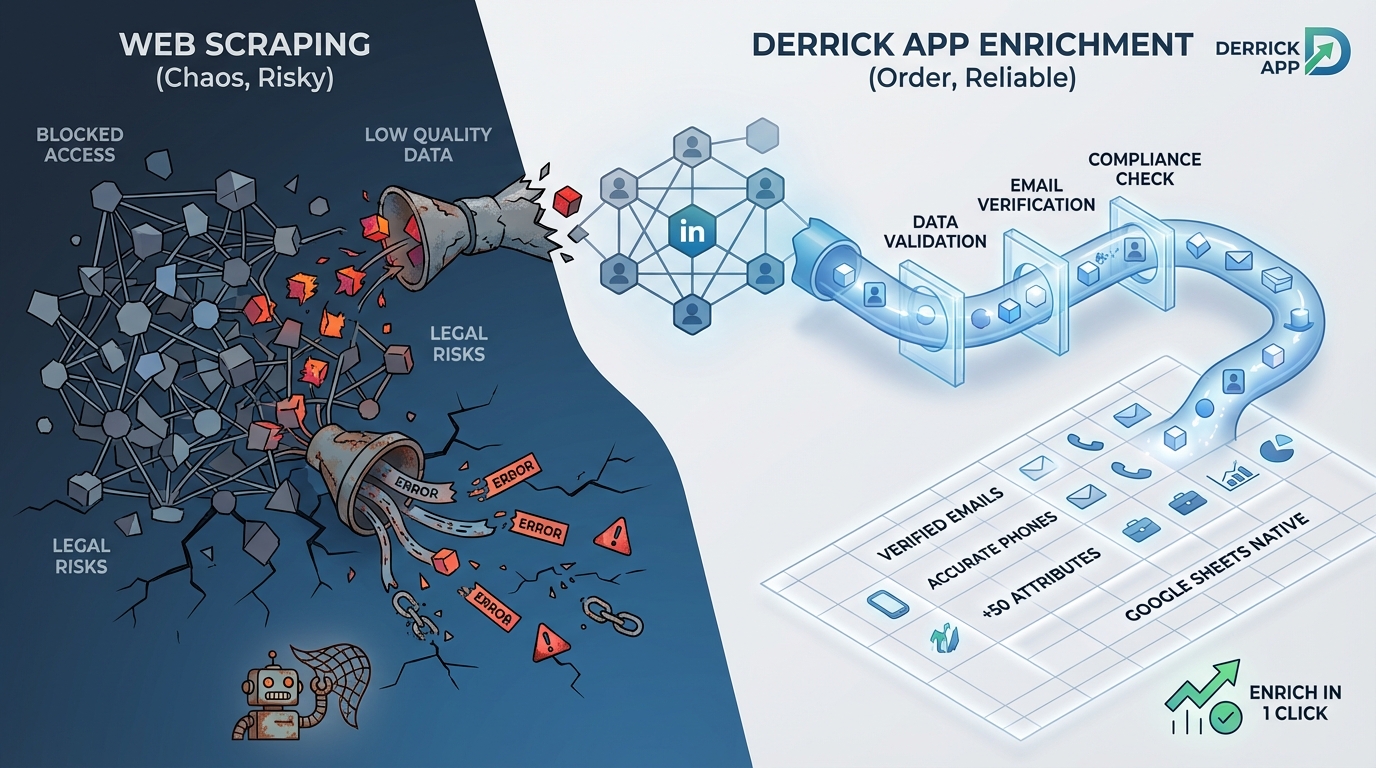
Data enrichment enhances existing data with third-party information via structured APIs. Web scraping, on the other hand, automatically collects publicly available data from any website. Choosing the wrong method can cost you time, money, and compromise your data quality.
In this guide, you’ll discover the fundamental differences between these two techniques, their respective advantages, and most importantly: how to choose the one that truly fits your business needs.
Enrich your leads directly in Google Sheets
Derrick finds emails, phone numbers, and 50+ attributes of your prospects in one click. No Sales Navigator needed, 100% native in Sheets.

What is data enrichment: definition and principles
Data enrichment consists of completing your existing data by adding information from reliable third-party sources. In practice, you start with minimal data — for example a name and company — and automatically obtain the professional email, phone number, job title, company size, and many other attributes.
This approach relies on structured APIs provided by specialized platforms like Derrick, Clearbit, or ZoomInfo. These APIs query massive databases, regularly updated, to return missing information reliably and instantly.
For an SDR prospecting 200 leads per day, enrichment transforms a simple LinkedIn name list into a qualified database with verified emails and phone numbers — all in minutes without manual intervention. This is what’s called a “push-button” approach: you provide minimal input, the tool handles the rest.
Enriched data comes from multiple aggregated sources: company registries, public legal databases, professional networks, web signals, and even crowdsourced data. The added value doesn’t lie in raw collection, but in the structuring, validation, and continuous updating of this data.
What is web scraping: definition and mechanism
Web scraping, also called web data extraction, is an automated technique for extracting information from web pages. Unlike enrichment which queries APIs, scraping directly analyzes the HTML code of sites to extract the data you need.
The process always follows three steps: first fetching (downloading the web page), then parsing (analyzing HTML code to locate data), and finally extraction (retrieving and structuring targeted information). A scraping script can thus automatically browse hundreds of pages to systematically collect specific data.
Take the example of a recruiter who wants to identify all Paris-based startups hiring Python developers. With scraping, they can automatically collect job postings published on Welcome to the Jungle, extract company names, their sectors, and their website URLs — information not available via a structured API.
The strength of scraping lies in its total flexibility: if data is visible on a website, it can be extracted. No need to wait for a provider to add it to their catalog. This autonomy explains why scraping remains massively used for competitive intelligence, price analysis, or data collection in niche markets.
Quick comparison table
| Criteria | Data Enrichment | Web Scraping |
|---|---|---|
| Data source | Structured APIs, aggregated databases | Public websites, HTML parsing |
| Data quality | Very high, validated in real-time | Variable, depends on source |
| Average cost | $0.05 to $0.50 per enrichment | Free if DIY, $50-500/month for tools |
| Maintenance | None (managed by provider) | High (sites change regularly) |
| GDPR compliance | Facilitated, compliant providers | Your responsibility, legal risks |
| Execution speed | Instant (APIs) | Slow (depends on page count) |
| Best for | Enriching CRM, existing leads | Collecting custom data, monitoring |
Detailed comparison: criteria by criteria
Data quality and reliability
Data enrichment: Data comes from aggregated and daily validated databases. Derrick, for example, verifies email validity in real-time via SMTP validation. Result: a deliverability rate above 95% on found emails. Firmographic information (headcount, sector, revenue) is cross-referenced with official registries like Companies House or SEC filings.
For a Growth Marketer launching a cold email campaign, this reliability is critical. Sending emails to invalid addresses degrades your sender reputation and can land your messages in spam. With enrichment, you’re sure the email found is active and belongs to the targeted person.
Web scraping: Quality depends entirely on the scraped source. If you extract data from LinkedIn or a company’s website, the information is generally up-to-date. However, scraping aging directories or forums can yield obsolete results.
The real problem with scraping: absence of automatic validation. You retrieve data “as is” without freshness guarantee. A phone number displayed on a site may have been deactivated for months. An email may be a generic address (contact@) rather than a nominative email.
Verdict: Data enrichment wins decisively on reliability, an essential criterion for professional prospecting.
Total cost of ownership (TCO)
Data enrichment: The business model relies on credits consumed per enrichment. Count $0.05 to $0.50 depending on the provider and data type (simple email vs full enrichment with 50+ attributes).
Take a concrete case: a SaaS startup enriching 1,000 leads per month. With Derrick at $9/month (4,000 credits), the unit cost drops to $0.002 per enrichment — easily absorbed in customer acquisition cost. For 10,000 leads/month, the Medium plan at $20 (10,000 credits) gives you a unit cost of $0.002.
The real advantage of the credit model: no surprises. You only pay for what you consume, and unused credits roll over. Zero development cost, zero maintenance.
Web scraping: Free on the surface if you develop your own scripts. But hidden costs explode quickly:
- Developer time: 2-5 days for a functional scraper (i.e., $1,500 to $3,500 at junior rate)
- Monthly maintenance: 3-5 hours (sites change their HTML structure)
- Infrastructure: rotating proxies, execution servers ($50 to $200/month for intensive scraping)
- Blocking risks: IP bans, CAPTCHAs, time wasted bypassing protections
For no-code tools (Phantombuster, Captain Data), count $50 to $500/month depending on volume. Advantage: no development. Disadvantage: you pay the subscription even if you scrape little.
Verdict: Data enrichment for regular professional use. Scraping only becomes cost-effective at very high volume or for very specific data unavailable elsewhere.
Ease of use and learning curve
Data enrichment: Accessible to all, without technical skills. In Derrick, you paste your data into Google Sheets, select the enrichment function (for example “Lead Email Finder”), and the tool automatically completes your sheet. Setup time: 5 minutes.
A Sales Ops person with no dev experience can enrich 10,000 contacts in less than an hour. This simplicity explains why 94% of companies consider data quality essential, but only 60% invest in structured enrichment solutions.
Web scraping: Two radically different options:
- Scraping with code (Python + BeautifulSoup or Scrapy): Requires programming skills. You must understand HTML, CSS selectors, HTTP requests, error handling. Steep learning curve for non-developers.
- No-code tools (Octoparse, ParseHub): Visual point-and-click interface. You select elements to extract directly on the page. More accessible, but limited to simple use cases.
The real problem with scraping: maintenance. As soon as a site changes its design or structure, your scraper breaks. You must fix it manually. On sites like LinkedIn that constantly evolve, this becomes a logistical nightmare.
Verdict: Data enrichment crushes scraping on simplicity. Unless you have a dedicated dev team, enrichment is the only scalable option.
GDPR compliance and legal aspects
Data enrichment: Professional providers (Derrick, Cognism, Lusha) manage GDPR compliance for you. They ensure data comes from legal sources, respects processing legal bases, and allows rights exercise (access, erasure rights).
By using a compliant enrichment API, you benefit from their compliance infrastructure. Your responsibility is limited to using data within a legitimate purpose (B2B prospecting) and respecting GDPR rules on your own processing.
Be careful though: not all providers are equal. Some aggregate data in questionable ways. Prioritize transparent actors on their sources who clearly indicate GDPR compliance.
Web scraping: Legal gray area. Scraping itself isn’t illegal if data is publicly accessible. But several points of vigilance:
- ToS violation: Many sites (LinkedIn notably) forbid scraping in their terms of use. Technically, you’re in contractual breach.
- GDPR: If you scrape personal data (names, emails), you must comply with GDPR. This implies a legal basis (legitimate interest for B2B prospecting), processing documentation, and the ability for people to exercise their rights.
- Lawsuit risks: Reddit recently sued Perplexity AI for massive scraping, alleging anti-bot measure violation. LinkedIn regularly blocks IPs that aggressively scrape.
Case law is evolving. In 2019, LinkedIn lost against hiQ Labs (scraping public profiles authorized). But in 2026, the 9th Circuit Court partially reversed this decision. In short: legal uncertainty.
Verdict: Data enrichment to sleep soundly. Scraping requires legal expertise and precautions most SMBs don’t have.
Scalability and execution speed
Data enrichment: Modern APIs process requests in milliseconds. Derrick can enrich 1,000 LinkedIn profiles in less than 10 minutes via its Import Sales Navigator. No throttling, no aggressive rate limits (except obvious abuse).
For a lead generation agency processing 50,000 contacts/month for various clients, API enrichment is the only scalable solution. You launch the batch, grab a coffee, and everything is automatically completed.
Web scraping: Inherently slow. Each web page must be downloaded, parsed, analyzed. If you need to scrape 10,000 LinkedIn profiles, even with a good scraper, count several hours (even days depending on anti-bot protections).
Moreover, sites impose rate limiting to avoid overload. Scraping too fast = IP ban. You must therefore artificially slow down, sometimes to 1-2 requests per second. Result: for large volumes, scraping becomes impractical.
Tools like Phantombuster partially bypass this by distributing requests across multiple proxies. But you pay for this infrastructure (and it’s still slower than an API).
Verdict: Data enrichment dominates without contest on speed and scalability.
Flexibility and data coverage
Data enrichment: Limited to the provider’s catalog. If you want to enrich with an exotic attribute (for example “number of podcasts where the person spoke”), no API will give it to you. You’re dependent on what platforms offer.
That said, major players cover 80% of classic B2B needs: emails, phones, job titles, company headcount, technologies used, social networks, etc. Derrick offers 50+ enrichment attributes per contact, which is more than enough for standard prospecting.
Web scraping: Total flexibility. If data exists on the web, you can scrape it. Want to analyze your competitors’ Google reviews? Scraping. Want to list all companies using Salesforce in France? Scraping BuiltWith or SimilarTech.
This freedom is valuable for very specific use cases or niche markets where no provider offers necessary enrichment. For example, scraping members of a closed LinkedIn group, or extracting Reddit comments from a specific community.
Verdict: Web scraping wins on pure flexibility. But for 90% of B2B needs, enrichment suffices.
Summary verdict table
| Criteria | Winner | Reason |
|---|---|---|
| Data quality | Data enrichment | Real-time validation, reliable aggregated sources |
| Cost (pro use) | Data enrichment | Lower TCO, no maintenance or dev |
| Ease of use | Data enrichment | Zero code, accessible to all |
| GDPR compliance | Data enrichment | Providers manage compliance |
| Scalability | Data enrichment | Instant APIs, no severe rate limits |
| Flexibility | Web scraping | Custom data, unlimited sources |
| Niche data | Web scraping | Only option for rare information |
Which tool to choose based on your profile
Choose data enrichment if:
- You already have a prospect list (LinkedIn names, companies, partial emails) and want to complete it with emails, phones, company info
- You do regular B2B prospecting: SDR, BDR, Growth Marketer, Sales Ops enriching daily or weekly
- You want a plug-and-play solution without technical skills, directly in Google Sheets or your CRM
- GDPR compliance is critical for you (regulated sectors, mature companies)
- You value reliability: high deliverability rate, validated data, no false positives
- Your budget allows $20-200/month depending on your enrichment volume
Example persona: Sarah, Sales Ops at a SaaS scale-up. She enriches 2,000 leads/month from LinkedIn campaigns and webinars. She uses Derrick directly in Google Sheets to add emails + phones in one click, then imports into HubSpot. Time saved vs manual research: 15 hours/month.
Choose web scraping if:
- You’re looking for very specific data unavailable from enrichment providers (e.g., customer reviews, job postings, technologies used on niche sites)
- You have a technical team capable of developing and maintaining scraping scripts
- Your volume is massive (100,000+ leads/month) and you have infrastructure to handle scraping at this scale
- You do competitive intelligence: price monitoring, content tracking, sentiment analysis on forums/Reddit
- You want to create your own proprietary database rather than depend on a third-party provider
- You master legal aspects and have validated that your scraping respects GDPR and sites’ ToS
Example persona: Tom, Data Analyst at an investment fund. He scrapes job postings from 500 startups to detect growth signals (massive hiring = probable funding round). No API provides this data. He developed a Python scraper that runs nightly and alerts the team on startups to contact.
When to combine data enrichment and web scraping
The two approaches aren’t mutually exclusive. The most mature teams intelligently combine them to maximize data coverage.
Recommended hybrid workflow
Step 1: Collection via scraping Use scraping to build your initial prospect list. For example, scrape members of a LinkedIn group or tech event participants. You get names, job titles, companies.
Step 2: Enrichment via API Pass this list through an enrichment tool (Derrick, Lusha, Apollo) to add verified emails, phones, and complete firmographic info. Typical match rate: 60-80%.
Step 3: Targeted complementary scraping For the unmatched 20-40%, use specific scraping (e.g., scrape the company’s site directly to find the generic email or switchboard number).
Result: You maximize coverage while keeping high quality on the majority of your database. And you reduce overall cost vs pure 100% enrichment.
Concrete use case: Lead gen agency
An agency generates leads for HR software targeting 50-500 employee companies. Workflow:
- Google Maps scraping: Extraction of 5,000 local companies in targeted size range (name, address, sector)
- Derrick enrichment: Adding HR emails + direct phone for 3,200 companies (64% match)
- Website scraping: For remaining 1,800, scraping site to identify HR contact (often displayed on “Join us” page)
- Final validation: Email verification via Derrick’s Email Verifier
Result: 4,500 qualified contacts (90% coverage) in less than 3 days of automated work. Total cost: ~$150 (enrichment credits + scraping proxies).
Legal aspects and compliance: what you need to know
GDPR: rules to respect
Whether you use enrichment or scraping, you process personal data. This subjects you to GDPR. Critical points:
Legal basis: For B2B prospecting, the typical legal basis is legitimate interest. You must be able to justify that your prospecting meets a legitimate business interest and that impact on individuals is minimal.
Purpose: You must use data only for declared use (commercial prospecting). Reusing it for something else (e.g., reselling the database) is prohibited.
Retention period: Don’t keep data forever. Typically, 3 years after last contact for an unconverted prospect. Then deletion or anonymization.
Individual rights: You must be able to process access, rectification, or deletion requests. Always include an unsubscribe link in your emails.
Processing registry: Document your processing activities in a GDPR registry (mandatory if >250 employees, recommended for all).
B2B vs B2C prospecting: the differences
B2B: GDPR is more flexible. You can prospect professional emails (@company.com) without prior consent, provided you respect legitimate interest and allow unsubscription.
B2C: Much stricter. Since the ePrivacy directive, you must obtain explicit consent before any email or SMS prospecting to individuals. Scraping personal addresses for B2C cold email is legally risky.
Robots.txt and ToS respect
Before scraping a site, always check its robots.txt file (accessible at www.site.com/robots.txt). This file indicates which pages can be crawled by bots.
Respecting robots.txt isn’t a strict legal obligation, but it’s a best practice that limits lawsuit risks. If a site explicitly forbids scraping in its ToS and you bypass it, you expose yourself to claims.
LinkedIn, for example, formally prohibits scraping in its general conditions. Massively scraping LinkedIn can lead to account ban, even lawsuits (see eBay vs Bidder’s Edge or LinkedIn vs hiQ Labs cases).
Mistakes to avoid (data enrichment and scraping)
Mistake 1: Not validating enriched emails
Impact: 30% bounce rate on your cold email campaign, degraded sender reputation, emails in spam.
Solution: Always use an Email Verifier after enrichment, even if the provider claims to provide validated emails. Double validation (enrichment + verification) is the professional standard. Derrick integrates real-time verification, but for data from other sources, use an SMTP validator.
Mistake 2: Scraping without respecting rate limiting
Impact: Permanent IP ban, account blocking, lost data.
Solution: Configure delays between each request (1-3 seconds minimum). Use rotating proxies to distribute load. Tools like ScraperAPI or Bright Data handle this automatically. If you develop your scraper, integrate throttling and retry logic.
Mistake 3: Mixing personal and professional data
Impact: GDPR violation, sanction risks (up to 4% of global revenue).
Solution: ONLY scrape or enrich professional emails for B2B prospecting. Personal Gmail, Outlook addresses are out of scope. Systematically filter to keep only business domains.
Mistake 4: Not documenting your processing
Impact: In case of regulatory audit, inability to prove compliance, aggravated sanctions.
Solution: Keep a GDPR registry even if you’re a small structure. Document: data origin, purpose, retention period, security measures. A simple Google Doc suffices to start.
Mistake 5: Scraping without managing structure changes
Impact: Your scraper breaks silently, you collect erroneous data without realizing it.
Solution: Set up automated tests that verify your scraper always returns consistent results. Log errors. Ideally, receive an alert if collected data count drops sharply.
Alternative: Derrick to enrich without scraping or coding
If you’re looking for a solution that combines scraping flexibility and enrichment reliability, Derrick offers the best of both worlds.
Why Derrick stands out:
- 100% native Google Sheets: No need to export CSVs or juggle between tools. You enrich directly in your spreadsheet.
- Sales Navigator import in 1 click: Retrieve your Sales Navigator searches without paying LinkedIn Premium subscription (save $1,200/year). Derrick intelligently scrapes for you.
- 50+ attributes per contact: Verified emails, phones, company info, technologies used, social networks, and even AI scoring.
- Simplified workflow: Select your function (Email Finder, Phone Finder, LinkedIn Scraper), click, it’s enriched. Even an intern can do it.
- Rollover credits: Your unused credits are never lost. Unlike classic subscriptions that reset each month.
Complete guide to B2B data enrichment
Discover all techniques and best practices to effectively enrich your prospect database.
Use case: A Growth Hacker wanting to prospect French tech startup decision-makers who raised over €5M.
- Sales Navigator import (search “CEO tech startups France 5M+ funding”) → 300 profiles
- Automatic Derrick enrichment → Emails + phones for 240 profiles (80% match rate)
- Adding Website Tech Lookup → Technologies used by these startups
- AI segmentation (Ask Claude) → Lead scoring by product fit
- Export to Lemlist for personalized cold email campaign
Total time: 20 minutes. Cost: 240 credits (about $5 with Small plan). Manual alternative: 8 hours of research + risk of invalid emails.
Conclusion: how to choose your approach
Data enrichment and web scraping aren’t competitors, but complementary tools answering different needs.
Prioritize enrichment if you do classic B2B prospecting and value speed, reliability, and legal compliance. It’s the scalable solution for 90% of sales teams.
Opt for scraping only if you have very specific needs (niche data, custom competitive intelligence) and technical resources to develop and maintain your scrapers.
And ideally, combine both: scraping to build initial prospect lists, enrichment to add verified contacts and business attributes. This hybrid workflow gives the best results.
To start simply, test Derrick for free. You’ll immediately see the difference between enriching manually and letting the tool work for you.
Test Derrick for free, no credit card required
200 free credits to discover automatic data enrichment in Google Sheets.
FAQ
Is web scraping legal? Yes, provided you scrape publicly accessible data and respect GDPR. You cannot scrape data behind a login or violate a site’s ToS that explicitly forbids scraping. For professional B2B, prioritize API enrichment which manages compliance.
What’s the difference between data enrichment and data cleansing? Data cleansing cleans your existing data by removing duplicates, errors, and obsolete information. Data enrichment adds new information to your existing data. Both are complementary: first clean your database, then enrich it.
How much does data enrichment cost per contact? Between $0.05 and $0.50 depending on provider and detail level. Derrick offers plans starting at $9/month for 4,000 credits, i.e., $0.002 per enrichment. Major players like ZoomInfo charge annual packages, often $10,000+ per year.
Can you legally scrape LinkedIn? LinkedIn prohibits scraping in its ToS. Technically, you risk account ban. Legally, case law is unclear: hiQ Labs won in first instance, but LinkedIn obtained partial review. To avoid risks, use Derrick’s Import Sales Navigator which respects LinkedIn limits.
How to verify an enrichment provider’s quality? Test it on a sample of 100-200 contacts. Check: match rate (% of enriched contacts), email validity (test with Email Verifier), info freshness (cross-check with LinkedIn). Prioritize providers transparent on their sources and GDPR compliance.
Do you need a developer for web scraping? Not necessarily. No-code tools like Octoparse or ParseHub allow scraping without coding via point-and-click interface. For complex needs (scraping JavaScript sites, bypassing anti-bot), technical skills become necessary.
Jonathan Maurin


Related Posts

Best cold email freelancers in New York in 2026
7 channels to find a cold email freelancer in New…

Best go-to-market agencies in the United Kingdom in 2026
7 UK GTM agencies compared in 2026: Gripped, The Marketing…


Best cold email freelancers in London in 2026
7 channels to find a cold email freelancer in London…