Sales velocity calculator
Enter four numbers from your pipeline: qualified opportunities, average deal size, win rate and sales cycle length. The calculator gives your sales velocity per day and per period, what each lever is worth, and, with a revenue target, the pipeline coverage you need.
Calculate your sales velocity
Enter four numbers for one period. Add a revenue target to see the pipeline coverage you need. The result updates as you type.
The calculator runs in your browser. Nothing is sent or stored. Amounts use whatever currency you type in.

At scale
derrick •
When the four numbers are wrong at the source
Velocity is only as good as the opportunities it counts. A deal whose contact has left, or whose account has changed, stays open and skews all four numbers. In the Derrick web app, refresh the companies and contacts behind your open opportunities before the pipeline review; how cleaner data speeds up deals is covered on our page about data enrichment and pipeline velocity.
- Web app: nothing to install, no credit card
- Free plan: 100 credits every month
- API and MCP from the Plus plan (€47.50/month)
Install the add-on and enrich your lists without leaving your spreadsheet.
Install in Google Sheets →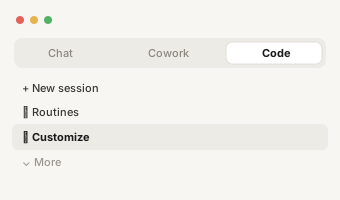
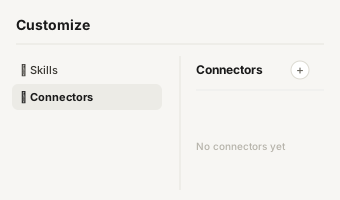
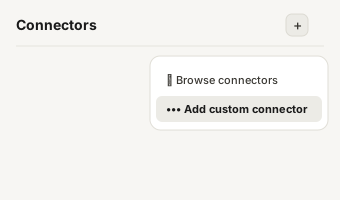
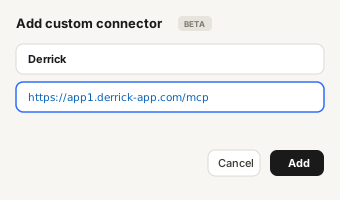
https://app1.derrick-app.com/mcp Call the same enrichment endpoints straight from your own stack or workflow.
Read the API docs →
How to use the sales velocit
How to use the sales velocity calculator
The sales velocity calculator needs four numbers, all taken from the same period and the same pipeline.
- Qualified opportunities. The deals open in your pipeline that passed your qualification step. Leads and early conversations do not count: they have no amount and no real chance of closing yet.
- Average deal size. The average amount of the deals you won over a recent period. Use won deals, not the amounts typed on open opportunities, which are often defaults or hopes.
- Win rate. Deals won divided by deals closed (won plus lost), from the same qualification step. A deal that ended in "no decision" counts as lost.
- Sales cycle length. The average number of days between the creation of an opportunity and its close, measured on won and lost deals together.
Then pick the period you plan in: month, quarter or year. Add a revenue target for that period if you have one. The calculator shows your velocity per day and per period, what a 10% move on each of the four numbers is worth, and, with a target, the pipeline coverage you need and what each lever would have to reach on its own.
Amounts have no currency attached: type them in euros, dollars or anything else, and read the results in the same unit. Nothing you type leaves your browser.

What sales velocity measures
What sales velocity measures
Sales velocity is the amount of revenue your pipeline produces per day at its current pace. It combines how many deals you work, how big they are, how often you win them and how long they take. A team can grow its revenue by moving any of the four, and the velocity number makes the trade-offs visible: more opportunities at a lower win rate can produce the same velocity as fewer, better ones.
Velocity is a pace, not a forecast. It assumes the next period looks like the last one. The longer definition, and how it relates to pipeline velocity, sits in our glossary entry on sales velocity.

The formula behind this calc
The formula behind this calculator
Sales velocity = qualified opportunities × average deal size × win rate ÷ sales cycle length in days. The result is revenue per day. Multiply it by the number of days in the period (30 for a month, 91 for a quarter, 365 for a year) to get revenue per period. The developed formula and its variants are explained in our entry on the sales pipeline velocity formula.

A worked example
A worked example
The example loaded in the calculator is illustrative: round numbers, no real company behind them. A sales team has 40 qualified opportunities open, an average won deal of 12,000, a win rate of 25% and an average cycle of 60 days. It plans by quarter, with a target of 250,000.
| Step | Calculation | Result |
|---|---|---|
| Sales velocity per day | 40 × 12,000 × 25% ÷ 60 | 2,000 per day |
| Velocity per quarter | 2,000 × 91 days | 182,000 |
| Coverage needed | 1 ÷ 25% | 4x |
| Pipeline needed for the target | 250,000 × 4 | 1,000,000 |
| Pipeline held today | 40 × 12,000 | 480,000 |
| Gap | 1,000,000 − 480,000 | 520,000 |
At its current pace, the team produces about 182,000 per quarter against a target of 250,000. To close the gap with one lever alone, it would need 55 opportunities instead of 40, or an average deal of about 16,500 instead of 12,000, or a win rate of about 34% instead of 25%, or a cycle of about 44 days instead of 60. None of these is a recommendation: they are four ways of reading the same gap, and the team decides which one it can actually move.

Reading the result
Reading the result: which of your four levers to move first
The "what each lever is worth" block changes one number by 10% and keeps the other three. In percentage terms the results are close by construction: a 10% gain on opportunities, deal size or win rate adds 10% of velocity, and a 10% shorter cycle adds about 11%, because the cycle divides. The arithmetic alone does not pick a winner.
What separates the levers is how hard each one is to move for your team, this period. Four questions help.
- Opportunities. Is the constraint the number of qualified deals entering the pipeline? If reps have spare time and the top of the funnel is thin, this is usually the fastest lever. It depends on the list you prospect and on how many of the accounts on it you can actually reach.
- Average deal size. Are you selling to the right size of company, and selling the whole offer? Moving up a size band raises the average deal, and usually lengthens the cycle: check both lines.
- Win rate. Are you losing deals you should not have qualified? A higher qualification bar raises the win rate and lowers the number of opportunities, and the net effect on velocity can go either way.
- Cycle length. Where do deals wait? A cycle shortens when the right people are involved early and when stalled deals are closed out instead of left open.
Because the four numbers move together, change one assumption at a time in the calculator and watch the other lines. A plan that raises deal size by 20% and lengthens the cycle by 20% leaves velocity where it was.
Month
Month, quarter or year: picking the period
Velocity per day does not depend on the period you choose. The period only changes how the daily figure is multiplied, and which target you compare it with. Three rules keep the result honest.
- Match the period to your target. If the team is measured on a quarterly number, pick the quarter and enter the quarterly target. Mixing a yearly target with quarterly pace makes the gap look four times bigger than it is.
- Look at the cycle before you pick a month. When the average cycle is longer than the period, most of the deals that will close this month are already in the pipeline. Velocity per month is still correct as a pace, but the lever moves you make this month will show up in the revenue of later months.
- Measure the four inputs on a window at least as long as your cycle. A win rate computed on the deals closed over two weeks, in a business with a 90-day cycle, is noise. Take the last two or three cycles' worth of closed deals for the win rate and the average deal size.
The calculator uses 30 days for a month, 91 for a quarter and 365 for a year. Those are conventions, not calendar days: what matters is that you use the same convention every time you compare.
When velocity drops
When velocity drops: reading the change
A single velocity number tells you little; the change from one period to the next tells you a lot. When velocity falls, enter last period's four numbers, then this period's, and see which one moved. Four patterns cover most cases.
- Fewer opportunities, everything else stable. The top of the funnel slowed: fewer accounts targeted, fewer of them reachable, or fewer meetings turned into qualified deals. The fix is upstream of the pipeline.
- Same opportunities, lower win rate. Either qualification loosened, or the deals now entering come from a segment or a source that converts less. Split the calculation by source to see which.
- Same win rate, longer cycle. Deals wait somewhere: a new approval step at buyers, a missing person in the conversation, or old deals that nobody closed out. Check how long open deals have been sitting in each stage.
- Smaller average deal. Usually a change in the mix: more small companies, or a discount policy. It is only a problem if the cycle did not shorten with it.
The same reading works upward: when velocity rises, find the input that moved before you credit a campaign or a hire.
Compare segments
Compare segments, reps or lead sources with the same four numbers
A single velocity number for the whole team hides most of what is useful. Run the calculator once per slice of your pipeline and compare the results side by side.
- By lead source. Inbound, outbound, partners and events rarely share the same deal size or win rate. A source with fewer opportunities can have the highest velocity.
- By segment. Small companies close fast for small amounts; large accounts close slowly for large ones. Velocity puts them on the same scale: revenue per day.
- By deal type. New business and expansion deals behave differently: expansion usually closes faster and more often, for smaller amounts. Blending them raises the win rate and shortens the cycle on paper, and hides how fast new logos actually come in. Run the two separately.
- By rep or team. Use it to spot where a team gets stuck, not to rank people. A low velocity with a normal win rate usually points at the cycle or the number of opportunities, not at selling skill.
For each slice, use the same definitions: the same qualification step, the same period, closed deals only for the win rate and the deal size. Otherwise the comparison measures your data, not your sales.
The pipeline coverage you ne
The pipeline coverage you need is 1 ÷ your win rate
Pipeline coverage compares the value of your open pipeline with your revenue target. Generic rules of thumb quote 3x, 3 to 4x or more, and they do not agree with each other because they assume different win rates. The coverage that fits your team follows from your own numbers: coverage needed = 1 ÷ win rate. With a 25% win rate you need 4x; with 20%, 5x; with 40%, 2.5x.
When you enter a target, the calculator applies that rule, multiplies the target by the coverage, and compares the result with the pipeline you hold today (opportunities times average deal size). Use the win rate measured from the stage where your open deals sit: a pipeline full of early-stage deals needs more coverage than one full of deals already in negotiation. More on the ratio in our glossary entry on pipeline coverage.
Before the pipeline review
Before the pipeline review: a five-point check
- Every open opportunity has an amount, an expected close date in the future and an owner.
- Opportunities with no activity for longer than your average cycle have been closed out or re-qualified.
- The win rate and the average deal size come from closed deals of the same period, "no decision" included as lost.
- The cycle length is measured on won and lost deals together.
- The contact on each open deal still works at the account, and the account still exists under the same name.
Run the calculator after this check, not before: the same pipeline can show a very different velocity once its dead weight is removed.
Two things that distort sale
Two things that distort sales velocity
The formula is simple; the inputs are where it goes wrong.
- Zombie opportunities. Deals nobody has touched in months stay "open", inflate the opportunity count and the pipeline value, and make both velocity and coverage look better than they are. Before you run the numbers, close out or re-qualify every opportunity with no activity over a period longer than your average cycle. An opportunity whose contact has left the company, or whose account was acquired, belongs in that review too.
- A cycle measured on won deals only. Won deals tend to close faster than lost ones, which drag on before they die. Measuring the cycle on wins alone shortens it, and inflates velocity. Measure it on every closed deal, won and lost.
Two smaller traps: amounts left at a default value on open deals (use won deals for the average), and win rates that ignore deals closed as "no decision" (count them as lost).
How keeping the accounts and contacts behind open deals current changes the speed of a pipeline is covered on our page about data enrichment and pipeline velocity.
The full list of metrics, from opportunities created to stalled deals, each computed on one worked quarter, is in our guide to sales pipeline metrics.