Last updated: 2026-06-18
Every B2B database is decaying right now, quietly, while it sits still. Contacts change jobs, companies reorganize, emails and phone numbers stop working, and a file that was accurate when you built it is materially wrong months later. This is the reference benchmark for B2B data decay: how fast it happens, how the rate differs by data type, what drives it, what it costs, and the refresh cadence that keeps a database trustworthy instead of letting it rot.
The single most important idea is that data is a flow, not a stock. A database is not an asset you buy once and own; it is a perishable that starts degrading the day it is assembled. Treating it as static is the root error behind most wasted campaigns, bad routing, and forecasts built on records that no longer describe reality. The fix is to re-verify at the point of use, on a cadence matched to how fast each field moves.
The canonical decay rate
The headline number, drawn from data-quality research and used as the reference throughout this series, is that B2B contact data decays at roughly 2.1 percent per month. Compounded over a year that works out to about 22 to 30 percent annually, meaning a quarter to nearly a third of a typical database is wrong within twelve months of being built. Gartner has placed the broader business-data decay rate even higher, near 3 percent per month, and under high-churn conditions annual decay climbs further.
Those percentages are easy to wave away in the abstract and brutal in practice. A list of ten thousand contacts losing two percent a month is two hundred records going wrong every month, every month, with no announcement. By the end of a year, two to three thousand of them point at someone who has moved, an email that bounces, or a company that has changed. The decay is invisible until a campaign hits the rotten portion and the results crater.
The reason the rate feels surprising is that nothing in a spreadsheet signals it. A cell holding a stale value looks identical to one holding a correct value; only an attempt to use it reveals the rot. That silence is exactly why decay is the most underestimated cost in B2B data, and why a benchmark like this one matters: it puts a number on a problem that otherwise never shows up until it is expensive. The freshness dimension is detailed in the data freshness guide.
It helps to read decay as a portfolio rather than a single number. A hundred-thousand-record file is not uniformly aging; it is splitting every month into a part that is still trustworthy and a growing part that quietly is not, and without measurement you cannot tell which record sits in which half. That is why an unmanaged file feels fine right up until a campaign or a territory plan hits the unreliable half at scale, and the failure looks sudden when it was actually gradual all along.
Decay by data type
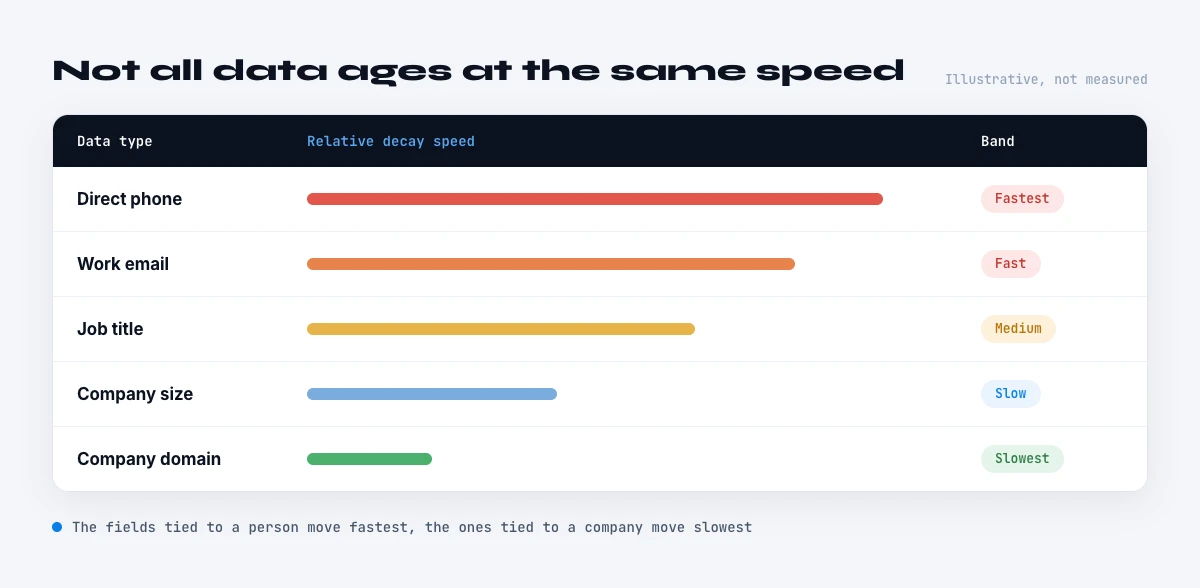
Decay is not uniform across fields, and treating it as a single rate hides where the real risk is. Email addresses follow the headline curve, roughly 22 to 30 percent invalid per year, as people change employers and addresses are deactivated. Direct phone numbers decay faster still, because they are tied to a specific role and desk: a single job change kills the direct line even when the person is still reachable on mobile. Job title and current company are the most volatile of all, because both are invalidated at once by a single move, and 15 to 20 percent of professionals change roles in a given year.
Firmographic fields sit in the middle and vary by attribute. Headcount and industry classification drift continuously as companies grow, pivot, and get reclassified; headquarters and legal status change with relocations and M&A; founding year is essentially permanent. Personal attributes like name are stable; role-and-organization attributes are not. The practical upshot is that a record can be perfectly correct on its stable fields and badly wrong on exactly the fields, current company, title, email, phone, that drive targeting and outreach.
This per-type variation is the most actionable part of the benchmark, because it tells you what to refresh and how often. There is no point re-verifying a founding year monthly or trusting a direct phone for a year. Matching refresh effort to each field's decay rate is how you keep a database accurate without re-checking everything constantly. The accuracy-versus-completeness distinction behind this is in the data accuracy guide.
The structural drivers
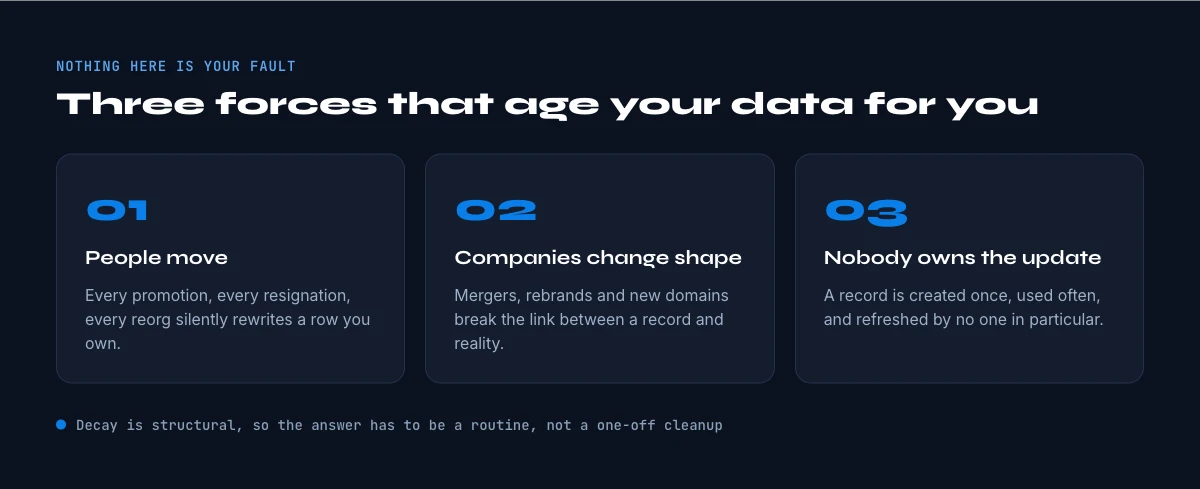
Decay is driven by measurable, structural forces, not random noise. The largest is job mobility: US labour statistics put median employee tenure at under four years and falling, and roughly 15 to 20 percent of professionals change roles annually, with each move capable of breaking an email, a direct line, a title, and a reporting structure at once. This single driver accounts for most contact-data decay, and it is accelerating rather than slowing.
The second cluster of drivers acts on company data: mergers and acquisitions, relocations, rebrands, reclassifications, and closures. Each can invalidate several firmographic fields in a single event, and at the record volumes of a real database these events are constant in aggregate. A firmographic file is therefore decaying from two directions at once, the people inside companies moving, and the companies themselves changing.
What makes these drivers important for planning is that they are not anomalies you can wait out; they are the normal background rate at which the world moves underneath a static list. You cannot out-purchase decay by buying a fresher file, because that file begins decaying immediately too. The only structural response is a process that re-verifies, not a one-time acquisition, however good. This is why a buy-once model loses to a verify-on-demand model on every perishable field.
There is also a lag that makes the real rate worse than the headline. People do not update their own records the instant they move, so at any moment a database holds a hidden layer of contacts who have already changed but whose record still reads as current. The visible accuracy of a list therefore overstates its true accuracy, because the not-yet-reflected movers look fine until you try to reach them and discover the move the hard way.
What decay costs
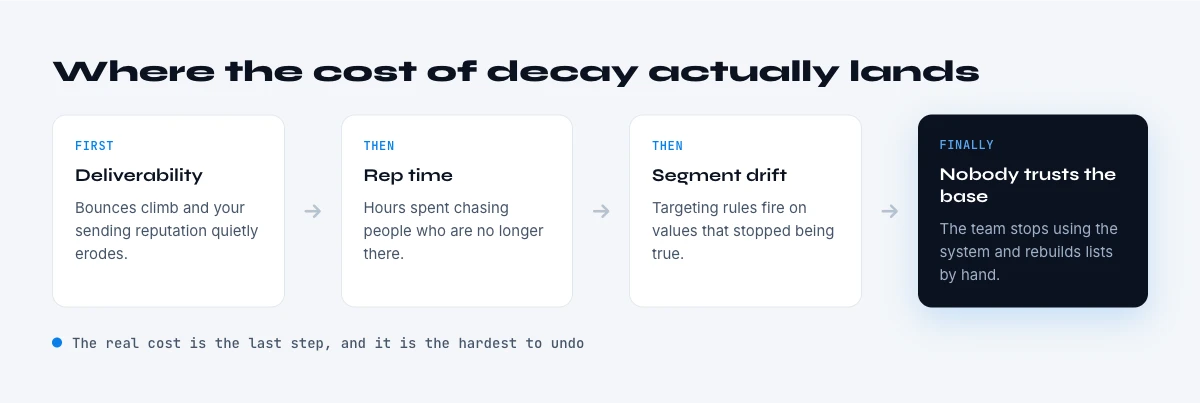
The cost of decay is large and compounding. Gartner estimates that poor data quality costs organizations an average of 12.9 million dollars per year, and decay is a primary contributor because the error propagates: a wrong field does not just fail once, it flows into segmentation, routing, scoring, personalization, and forecasting, and every system that consumes it inherits the mistake. A single stale record replicated across a stack is far more expensive than the record itself.
There is also a deliverability multiplier specific to contact data. Sending to decayed email addresses generates bounces, bounces damage sender reputation, and a damaged reputation suppresses delivery of the valid addresses too, so a partly stale list underperforms by more than its stale fraction. The same logic applies to phone: time spent dialing dead numbers is non-selling time, and it hides inside connect-rate metrics that get blamed on the script rather than the data.
The cleanest way to internalize the cost is the half-life: the point at which half of a list's most useful fields are wrong. With volatile fields decaying at 15 to 30 percent a year, a list left unmaintained crosses meaningful unreliability within months and approaches a coin-flip on its key fields within a couple of years. Knowing your half-life turns decay from a vague worry into a schedule you can manage. The direct cost framing is in the cost of missing data guide.
The refresh cadence model
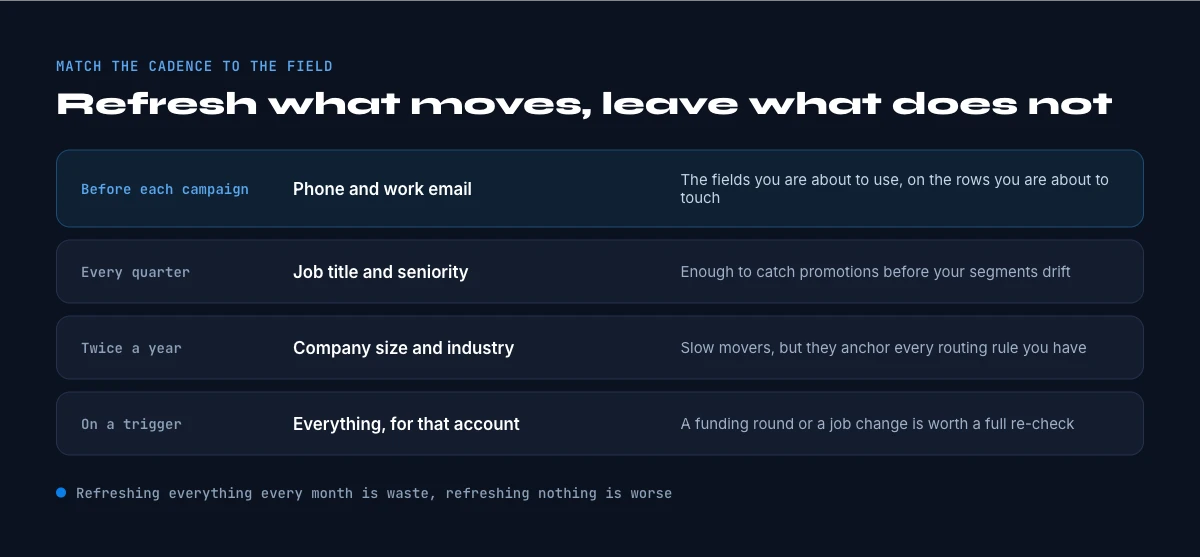
The answer to decay is a refresh cadence keyed to per-field volatility, not a quarterly clean of everything. Re-verify the fastest-moving fields, current company, title, email, and direct phone, at or near the point of use; re-check moderately stable firmographics periodically; and leave genuinely stable fields alone. The principle is to refresh by need and by decay rate, and the most reliable point to confirm a field is the moment before you act on it, because everything between capture and use is unseen decay.
This is exactly the model Derrick is built for. Rather than maintaining a static file, Derrick re-verifies and enriches records on demand, directly inside Google Sheets, finding and verifying emails and phone numbers and refreshing company and profile data at the moment you need them. The captured snapshot becomes a live record, which mechanically answers the decay this benchmark documents, without pretending any database can be bought once and trusted indefinitely. Living data, re-verified on demand, beats a frozen stock on every perishable field.
Re-verify your data on demand with Derrick, free for 100 credits per month, directly in Google Sheets. Estimate your monthly decay, set a per-field refresh cadence, and confirm the volatile fields before each use. The broader quality picture is in the B2B data quality benchmarks report.
A practical way to measure your own decay is to re-verify a sample. Take a few hundred records you captured several months ago and check them today: the share that now bounces, has a changed title, or sits at a different company is your real decay rate for that segment and time window. Run that once and the abstract percentages in this benchmark become your own numbers, which is usually enough to settle any debate about whether a refresh process is worth it.
The cadence model also reframes how to budget for data. Instead of a large periodic spend re-buying or re-cleaning an entire database, you spend a little per record at the moment it matters, which is both cheaper in aggregate and far more accurate, because you only pay to verify what you are about to use. A verify-on-demand budget tracks actual usage rather than database size, and it never funds the verification of records that decay untouched in a corner of the file.
This is the difference between maintaining a warehouse and drawing from a tap. A warehouse of contacts has to be guarded against decay across its whole volume, most of which you never use; a tap delivers a fresh record exactly when you reach for it. For every perishable field, the tap wins, which is why the refresh cadence and the on-demand model are really the same idea viewed from two angles.
Methodology and sources
This benchmark consolidates the canonical B2B data-decay figures used across this report series: the roughly 2.1 percent per month contact-data decay rate compounding to about 22 to 30 percent per year, Gartner's estimates for business-data decay and the cost of poor data quality, and US labour statistics on job tenure and mobility as the structural driver. Per-field rates are presented as a market consensus and recalculated for illustration; where a decay statistic could only be traced to a data or enrichment vendor's marketing, we did not cite it, and figures without a clean primary source were left out rather than attributed loosely.
A closing thought. The instinct is to ask which provider has the most accurate data, as if accuracy were a property you purchase. Decay says accuracy is a property you maintain: the best file in the world is wrong on a quarter of its volatile fields within a year, and a worse file re-verified on demand will beat it where it counts. Stop buying data as a stock to own and start treating it as a flow to refresh, on a cadence matched to how fast each field moves, and the decay documented here stops being a hidden tax and becomes something you simply manage, field by field, at the only moment that matters: the one just before you use the data.
Frequently asked questions
How fast does B2B data decay?
Do all fields decay at the same rate?
What drives data decay?
How much does decay cost?
What refresh cadence should I use?
Continue exploring this cluster
Start enriching your sheet in 30 seconds
Free for 100 credits/month. No credit card.
Install Derrick free →