Last updated: 2026-06-18
Every team integrating a data enrichment API compares the same things: endpoints, coverage, price per call. Almost none of them compare the two variables that actually decide whether the integration works in production: reliability and data quality. This report benchmarks the state of data enrichment APIs in 2026, the size and growth of the market, the math of composite availability that quietly erodes uptime, the reality of enrichment SLAs, and why fresh, accurate data matters more than the number of endpoints on the page.
The thesis is that an enrichment API is only as good as its weakest production property, and that property is almost never the endpoint list. A fast API serving stale data produces confident, wrong answers at scale. A feature-rich API that is down when you call it produces nothing. Reliability and data quality, not breadth, are the criteria that survive contact with production, and they are the ones this report is built around.
The data enrichment API market in 2026
The market is growing steadily, pulled by demand for clean data to feed AI. Market-research estimates from Mordor Intelligence put the global data enrichment market at about 2.57 billion dollars in 2024, growing toward roughly 4.65 billion by 2029 at around 12.5 percent a year; Grand View Research projects a similar trajectory, reaching the mid-4-billion range by 2030 at roughly 10 to 12 percent CAGR. The exact figures vary by firm, but the direction is unambiguous: enrichment is becoming infrastructure.
The demand driver is worth naming. As organizations pour budget into AI, the value of that spend is capped by the quality of the data feeding it, which turns enrichment from a sales-ops nicety into a prerequisite for AI initiatives. That shift is why enrichment is increasingly consumed as an API, a programmatic dependency inside other systems, rather than as a standalone tool a human operates.
This reframes what you are actually buying. When enrichment is an API embedded in your stack, it is no longer a tool you evaluate on features; it is a dependency you evaluate on reliability and data quality, the same way you would evaluate any other piece of production infrastructure. The rest of this report treats it that way. The architecture choices behind this are covered in the API architecture guide.
There is a subtle consequence of enrichment becoming infrastructure: the buyer changes. The decision used to sit with a sales-ops lead choosing a tool; increasingly it sits with an engineering or RevOps team choosing a dependency, with all the scrutiny that implies. That audience asks the questions this report is built around, availability, error rates, rate limits, data freshness, rather than which logos are on the homepage, and a provider that cannot answer them concretely is not a serious option for a production integration.
The composite availability problem
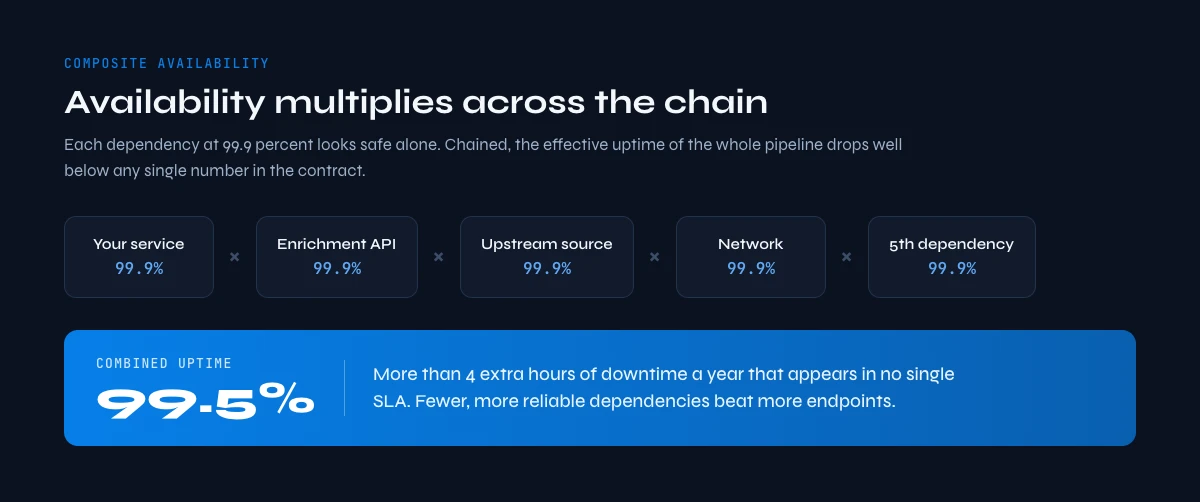
Here is the number nobody on the buying side calculates. A single API advertised at 99.9 percent availability is allowed about 8.76 hours of downtime per year. That sounds fine in isolation. But enrichment rarely happens through one dependency: a typical pipeline chains several, your code, the enrichment API, its upstream data sources, the network. Availability multiplies across a chain, so five independent dependencies each at 99.9 percent yield roughly 99.5 percent combined, which is more than four additional hours of downtime per year you never see in any single SLA.
This composite-availability math is the single most overlooked factor in enrichment reliability. Every additional API you stack into a pipeline lowers the effective availability of the whole, because the failures are independent and compound. A team that integrates three or four enrichment providers to maximize coverage can easily end up with worse real-world uptime than a team that uses one reliable, broad source, even though each individual provider's SLA looks reassuring.
The practical implication is to count dependencies, not just read SLAs. The right question is not what uptime a single API promises, but what the composite availability of your whole enrichment chain works out to once you multiply the links. Fewer, more reliable dependencies usually beat more endpoints, because reliability is multiplicative and degrades fast. The rate-limit dimension of this is covered in the rate limits guide.
It is worth making the composite math concrete with a second example. Suppose your pipeline depends on your own service, one enrichment API, and that API's own upstream source, three independent links. If each runs at 99.9 percent, the combined availability is about 99.7 percent, roughly 26 hours of downtime a year rather than the 8.76 the single SLA implied. Add a fourth and a fifth link to chase coverage and you slide toward 99.5 percent and beyond. The lesson is not that dependencies are bad, it is that each one has a reliability cost that has to be weighed against the coverage it adds.
The reality of enrichment SLAs
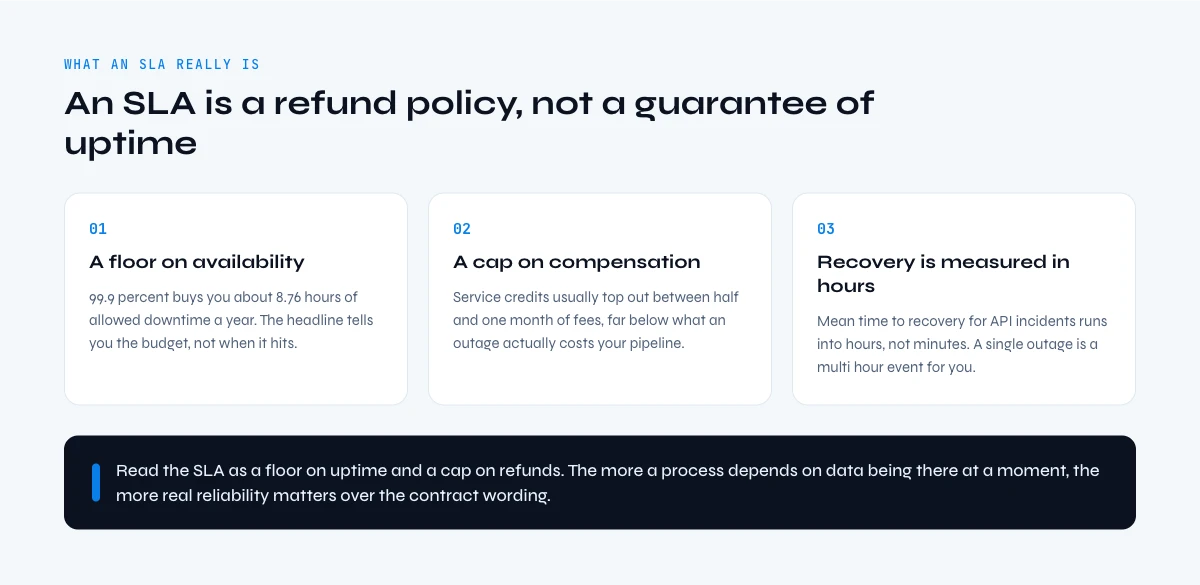
SLAs are reassuring on paper and weak in practice. API failures are a major share of production incidents, and recovery is not instant: mean time to recovery for cloud and API incidents commonly runs into the hours, not minutes, so even a well-run provider's outage is a multi-hour event for your pipeline. The headline availability number tells you the budget for downtime; it does not tell you how long any single outage will last when it hits during your peak.
The compensation is weak too. Most enterprise SLAs that promise high availability cap their service credits at a fraction of the monthly fee, often somewhere between half and the full month, which means the financial remedy for an outage is small relative to the business cost of bad or missing enrichment during it. An SLA is a refund policy, not a guarantee of uptime, and the refund is capped well below what the downtime actually costs you.
So read SLAs for what they are: a floor on availability and a cap on compensation, not a promise that the data will be there when you need it. The more your business process depends on enrichment being available at a specific moment, the more the real reliability of the provider matters relative to the contractual language. The SLA detail is in the SLA and uptime guide.
This also changes how you should think about redundancy. Adding a backup enrichment provider can improve coverage and resilience, but only if it is a genuine fallback rather than another always-on link in the chain. Used as a parallel fallback, a second source raises effective availability; used as an additional required step, it lowers it. The architecture matters as much as the vendor, which is why dependency design, not endpoint shopping, is the real engineering work in an enrichment integration.
Why data quality beats endpoint count
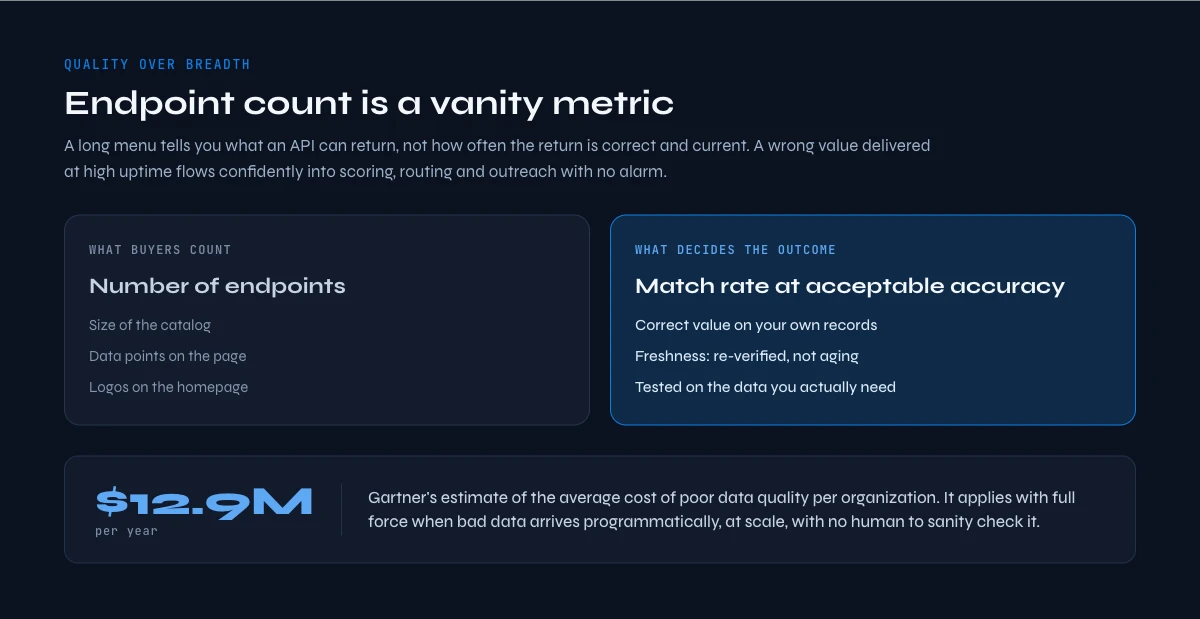
Reliability gets the data to you; quality decides whether it was worth getting. An enrichment API can be perfectly available and still hand you stale or wrong values, and a wrong value delivered with high uptime is arguably more dangerous than a missing one, because it flows confidently into scoring, routing, and outreach without tripping any alarm. Gartner's estimate that poor data quality costs organizations an average of 12.9 million dollars per year applies with full force when bad data arrives programmatically, at scale, without a human in the loop to sanity-check it.
This is why endpoint count is a vanity metric. A long list of endpoints tells you what the API can return, not how often the return is correct and current. Two enrichment APIs with identical endpoint lists can produce opposite business outcomes depending on the freshness and accuracy of the data behind them, and that difference never shows up in the documentation. The number that matters is match rate at acceptable accuracy on the data you actually need, not the size of the menu.
The consequence for buyers is to evaluate data quality as rigorously as availability. Test the API on your own records, measure how often the returned value is correct and current, and weight that far above the breadth of the endpoint catalog. An API that does fewer things reliably and freshly is worth more than one that does many things on data you cannot trust. The build-or-buy economics of this are in the build vs buy guide.
A buyer's decision framework
Evaluate an enrichment API on six criteria, in roughly this order of importance. First, data quality and match rate on your records, measured, not advertised. Second, freshness: is the data re-verified, or served from an aging store. Third, availability, including the composite availability of your whole chain, not just the single advertised number. Fourth, rate limits and how they behave under your real peak volume. Fifth, security and compliance posture. Sixth, the pricing model, ideally a transparent credit model that scales with use rather than a rigid tier that punishes either small or large volume.
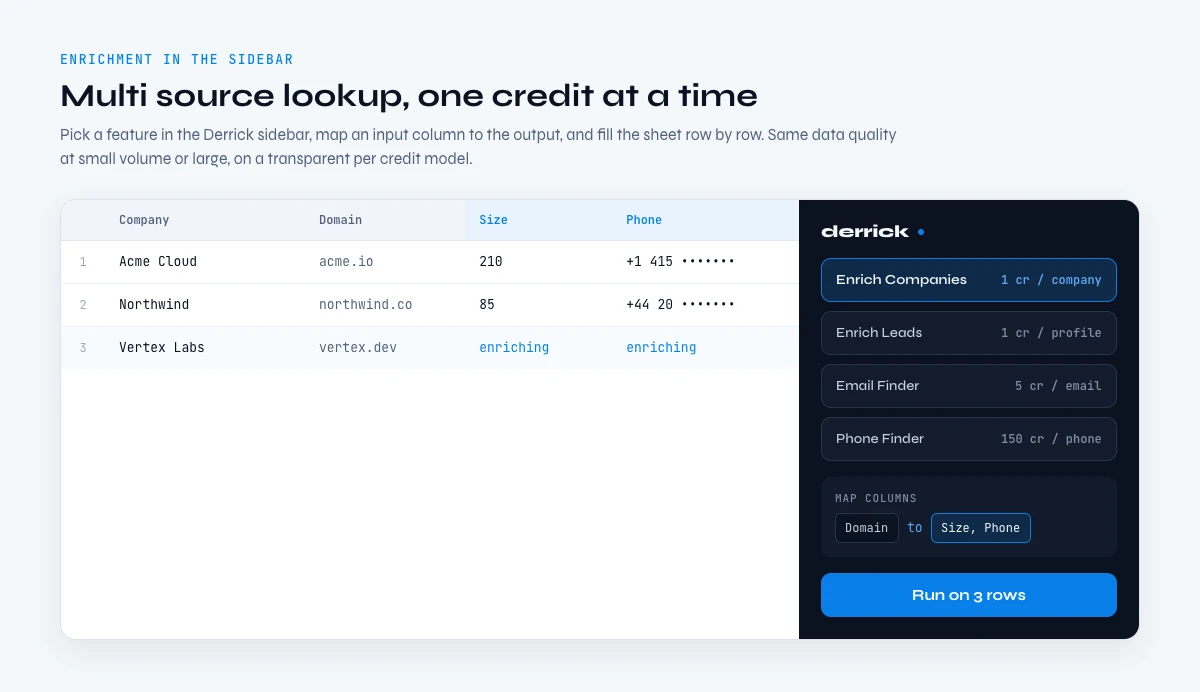
This is the ground Derrick is built for. Derrick offers programmatic and API access to its multi-source lookup, finding and verifying emails and phone numbers and enriching profile and company data, with availability and data quality designed to hold at scale, small volume or large. It is consumable as an API and through 3000-plus integrations via Zapier, Make, and N8N, on a transparent per-credit model, so reliability and quality are properties of the service rather than promises in a contract. We are not claiming a perfect SLA on paper; we are pointing at the criteria that actually decide an integration, and building toward them.
Evaluate Derrick's enrichment for reliability and data quality, free for 100 credits per month, with API and integration access on a transparent per-credit model. Start by testing match rate and freshness on your own records, then count the dependencies in your chain before you add another endpoint. The security posture is detailed in the API security guide within this cocon.
Pricing deserves a closer look as a reliability signal in its own right. A rigid per-seat or per-tier model often hides the real cost of scale, you pay for capacity you do not use at low volume and hit walls at high volume, neither of which matches how API consumption actually behaves. A transparent per-credit model lines cost up with usage, which is both fairer and a sign that the provider expects to be measured on volume that varies, the normal state of a production integration.
A final caution on benchmarking: test under your real conditions, not the vendor demo. Match rate on a curated sample, latency at light load, and uptime on a quiet week all flatter the provider. The numbers that matter are match rate on your messy production records, latency at your peak concurrency, and availability across your whole chain over a quarter. Anything measured under easier conditions is marketing, not a benchmark.
Methodology and sources
This report aggregates primary, non-vendor sources: Mordor Intelligence and Grand View Research for data enrichment market size and growth; Gartner for the cost of poor data quality and AI-spend trends; and public, mathematical principles for availability (99.9 percent equals about 8.76 hours of downtime per year, and independent availabilities multiply across a dependency chain). Uptime and incident figures are presented as widely established industry principles rather than vendor claims. Where a statistic could only be traced to a data or enrichment vendor's own marketing, we did not use it.
A closing thought for anyone integrating enrichment. The temptation is to choose on breadth, the longest endpoint list, the most data points, the biggest catalog. Production rewards the opposite discipline: choose on reliability and data quality, count your dependencies, measure freshness on your own records, and treat the SLA as a floor rather than a promise. An enrichment API is infrastructure now, and infrastructure is judged by whether it is there and correct when you call it, not by how much it could theoretically do. Build the integration on that standard and the breadth takes care of itself.
Frequently asked questions
How big is the data enrichment API market in 2026?
What is composite availability?
Do enrichment SLAs really protect you?
Is endpoint count a good selection criterion?
How does Derrick position as an enrichment API?
Continue exploring this cluster
Start enriching your sheet in 30 seconds
Free for 100 credits/month. No credit card.
Install Derrick free →