
Cost per lead: the 2026 benchmarks, and the lever that lowers yours
Compare your cost per lead against 27 industry benchmarks, see how it splits by channel, and cut the qualified-lead version with enrichment.


You're spending thousands on lead generation, and yet your sales reps spend most of their day chasing prospects that were never a fit for your ICP in the first place. Your cost per qualified lead keeps climbing, your pipeline stagnates, and your team is exhausted.
The problem isn't your budget. It's your data quality.
In this guide, you'll learn what cost per qualified lead actually measures, why it's typically 2 to 3 times higher than it should be, and how data enrichment brings it down significantly - without increasing your acquisition spend.
What is cost per lead (CPL), and how do you calculate it
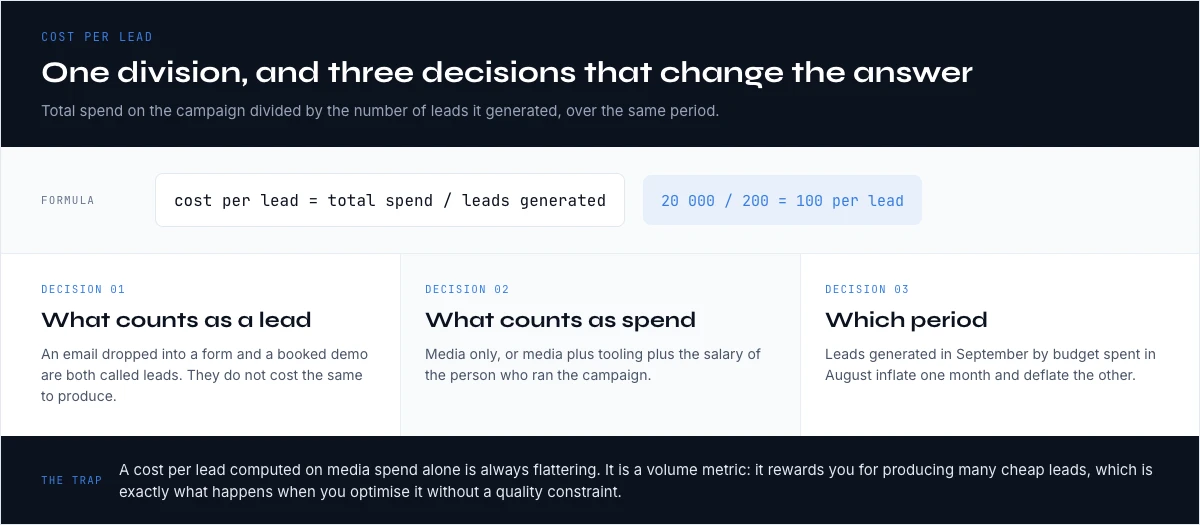
Cost per lead is the average amount you spend to generate one lead. You calculate it by dividing total campaign spend by the number of leads that campaign produced, over the same period.
Cost per lead = total spend on the campaign / number of leads generated. Spend 20 000 dollars and collect 200 leads, and your cost per lead is 100 dollars.
Three details decide whether that number tells you anything. The first is what counts as a lead: an email address dropped into a form and a booked demo are both called leads, and they do not cost the same to produce. The second is what counts as spend: media budget only, or media plus tooling, plus the salary of the person who ran the campaign. A cost per lead computed on media alone is always flattering. The third is the period: leads generated in September by budget spent in August will inflate one month and deflate the other unless you align the windows.
Cost per lead is a volume metric. It rewards you for producing many cheap leads, which is exactly what happens when you optimise it without a quality constraint. That is the reason the rest of this guide moves to cost per qualified lead, but the raw number is where every diagnosis starts, and it is worth benchmarking before you do anything else.
Average cost per lead by industry: the 2026 benchmarks
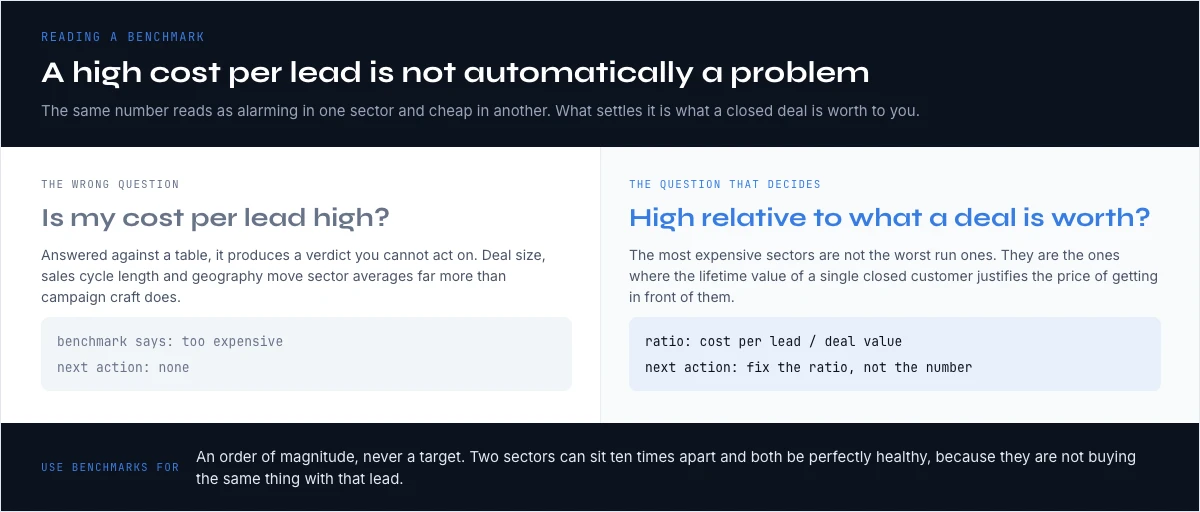
A cost per lead of 250 dollars is alarming in eCommerce and cheap in cybersecurity. Published industry benchmarks for 2026, blended across paid and organic acquisition, put the spread between roughly 91 and 982 dollars per lead depending on the sector. Here are the numbers, sorted from the cheapest sector to the most expensive.
| Industry | Average cost per lead (2026) |
|---|---|
| eCommerce | 91 dollars |
| HVAC | 92 dollars |
| Entertainment | 114 dollars |
| Pharmaceutical | 131 dollars |
| Solar | 206 dollars |
| Construction | 227 dollars |
| B2B SaaS | 237 dollars |
| Biotech | 255 dollars |
| Hotels and resorts | 266 dollars |
| Environmental services | 278 dollars |
| Automotive | 283 dollars |
| Engineering | 287 dollars |
| Healthcare | 361 dollars |
| Aerospace and aviation | 373 dollars |
| Cybersecurity | 406 dollars |
| Business insurance | 424 dollars |
| Real estate | 448 dollars |
| Fintech | 452 dollars |
| Staffing and recruiting | 497 dollars |
| IT and managed services | 503 dollars |
| Manufacturing | 553 dollars |
| Transportation and logistics | 588 dollars |
| Software development | 591 dollars |
| Oil and gas | 637 dollars |
| Legal services | 649 dollars |
| Financial services | 653 dollars |
| Higher education | 982 dollars |
Blended paid and organic averages from published 2026 industry benchmarks, last updated December 2025. Treat them as an order of magnitude, not a target: deal size, sales cycle length and geography move these numbers more than campaign craft does.
Two readings matter here. The first is that a high cost per lead is not automatically a problem. Higher education sits at 982 dollars because the lifetime value of an enrolled student justifies it. The question is never whether your cost per lead is high, it is whether it is high relative to what a closed deal is worth to you. The second is that the spread between the cheapest and the most expensive sector is more than tenfold, which means any benchmark quoted without an industry attached is noise.
Cost per lead by channel: where the same budget buys more
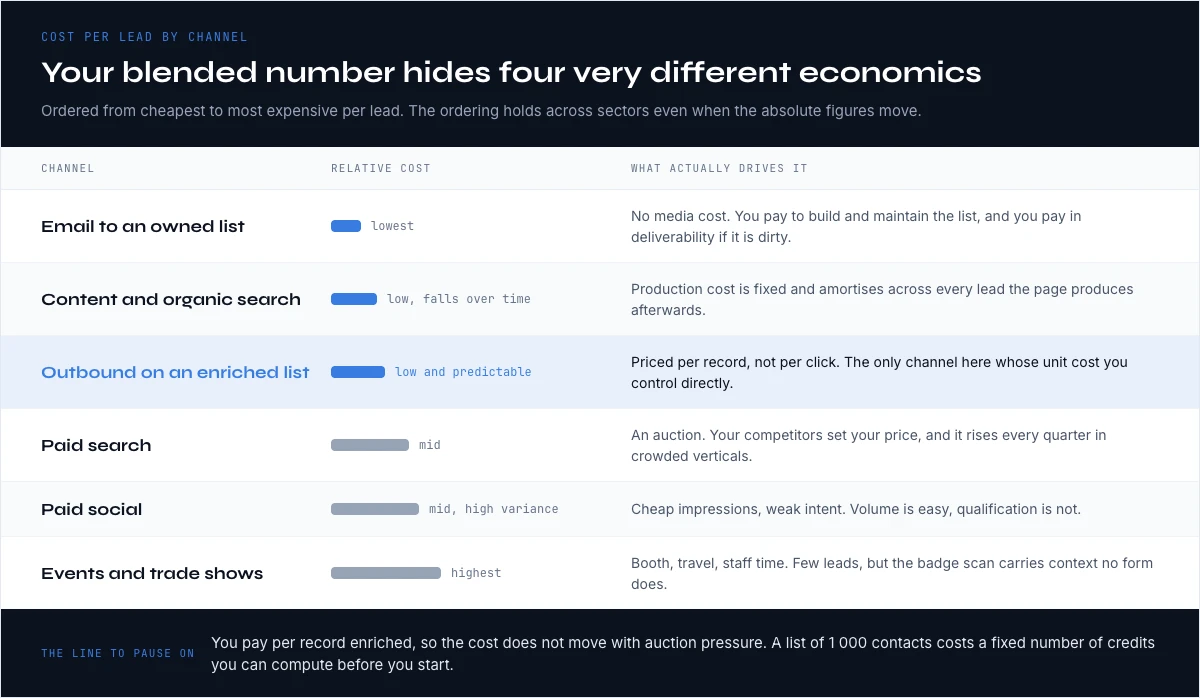
Your blended number hides three or four very different economics. Published channel benchmarks put email marketing to an owned list in the single-digit to low-double-digit dollars, and paid search in the mid-thirties and above before you reach a regulated vertical, where the same click can cost several times more. The pattern below holds across sectors even when the absolute figures move.
| Channel | Where it sits on cost per lead | What actually drives the cost |
|---|---|---|
| Email to an owned list | Lowest, single digits to low tens of dollars | No media cost. You pay to build and maintain the list, and you pay in deliverability if it is dirty. |
| Content and organic search | Low, and it falls over time | Production cost is fixed and amortises across every lead the page produces afterwards. |
| Outbound on an enriched list | Low and predictable, priced per record | You pay per contact enriched, not per click, so the cost does not move with auction pressure. |
| Paid search | Mid, from the mid-thirties upward | An auction. Your competitors set your price, and it rises every quarter in crowded verticals. |
| Paid social | Mid, high variance | Cheap impressions, weak intent. Volume is easy, qualification is not. |
| Events and trade shows | Highest per lead | Booth, travel, staff time. Few leads, but the badge scan carries context no form does. |
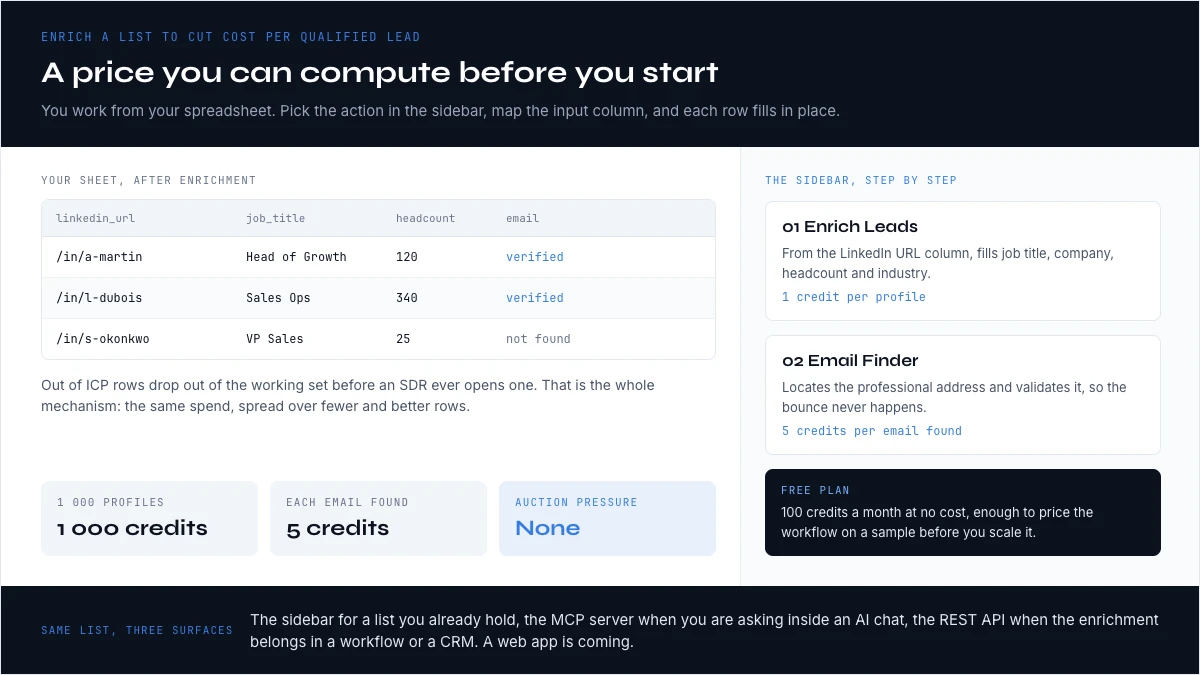
The line worth pausing on is the third one. Outbound on an enriched list is the only channel in that table whose unit cost you control directly, because you are paying per record rather than bidding against anyone. With Enrich Leads at 1 credit per profile and Email Finder at 5 credits per email found, a list of 1 000 contacts enriched and made contactable costs a fixed number of credits you can compute before you start, and the free plan gives 100 credits a month to price your own list before committing anything.
From cost per lead to cost per qualified lead: the number that decides your pipeline
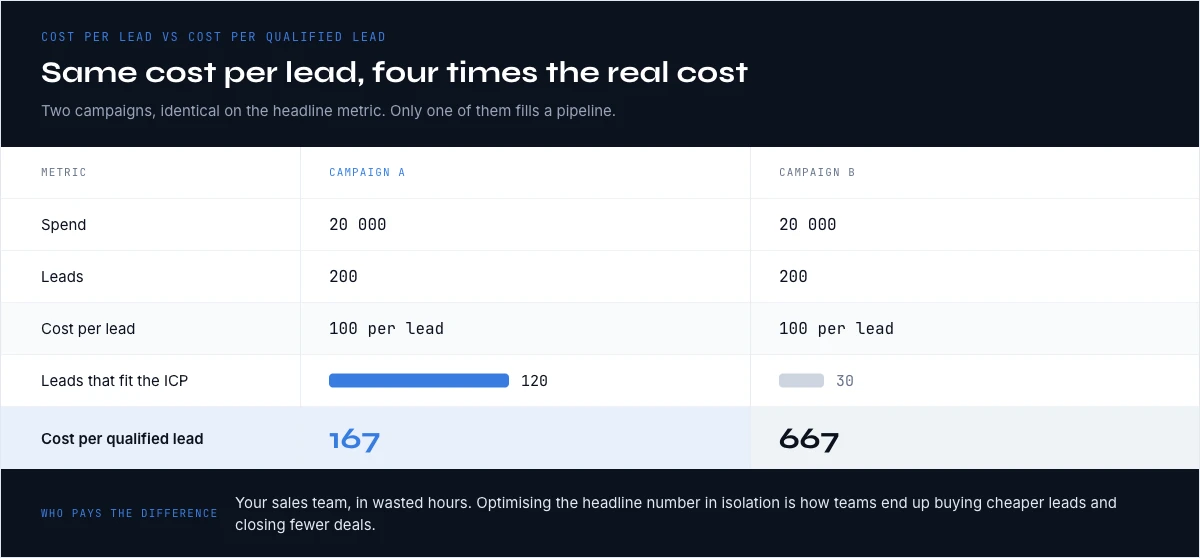
Benchmarks tell you whether your cost per lead is normal. They do not tell you whether it is useful. A campaign that produces 200 leads at 100 dollars each looks identical, on that metric, to one that produces 200 leads at 100 dollars each of which 30 fit your ICP and 170 do not. The first costs 100 dollars a lead. The second costs 667 dollars a qualified lead, and your sales team pays the difference in wasted hours.
| Campaign A | Campaign B | |
|---|---|---|
| Spend | 20 000 dollars | 20 000 dollars |
| Leads | 200 | 200 |
| Cost per lead | 100 dollars | 100 dollars |
| Leads that fit the ICP | 120 | 30 |
| Cost per qualified lead | 167 dollars | 667 dollars |
Same cost per lead, four times the real cost. This is why optimising the headline number in isolation is how teams end up buying cheaper leads and closing fewer deals. The rest of this guide is about the second row: what cost per qualified lead measures, why yours is probably two to three times higher than it needs to be, and how enrichment brings it down without touching your acquisition budget.
In the web app or Google Sheets
Stop paying for the leads you cannot reach
A qualified lead you have no address for still sits in the cost per lead. Derrick charges only for addresses it returns, so the unreachable rows leave the numerator of your calculation instead of quietly inflating it.
- Feature
- Lead Email Finder
- Credit cost
- 5 credits per email found
The first button opens the web app (nothing to install): 5 credits per email found, available from the STANDARD plan. The second details the feature and its cost per plan.
Cost per Qualified Lead: Definition and Difference from Standard CPL
Cost per qualified lead (CPQL) measures how much you spend, on average, for each prospect who genuinely matches your ICP and is ready to enter a sales cycle.
It differs from standard CPL (cost per lead) on one key point: CPL counts every contact generated, regardless of relevance. CPQL only counts those who pass a qualification filter.
Cost per qualified lead formula:
CPQL = Total acquisition spend ÷ Number of qualified leads generated
| Metric | What it measures | Limitation |
|---|---|---|
| CPL (cost per lead) | Cost of every contact generated | Ignores lead quality |
| CPQL (cost per qualified lead) | Cost of every ICP-fit lead | Requires complete data to qualify |
| CAC (customer acquisition cost) | Full cost to close a customer | Downstream metric, slower to measure |
For an SDR prospecting 150 contacts a week, the gap between a $12 CPL and an $85 CPQL is significant: it means that out of 100 leads, only 14 were worth pursuing. The other 86 consumed sales time for nothing.
That's exactly where data enrichment comes in. But first, let's understand why your CPQL is likely higher than it should be.
Why Your Cost per Qualified Lead Is Too High
1. Your prospect lists are missing qualification attributes
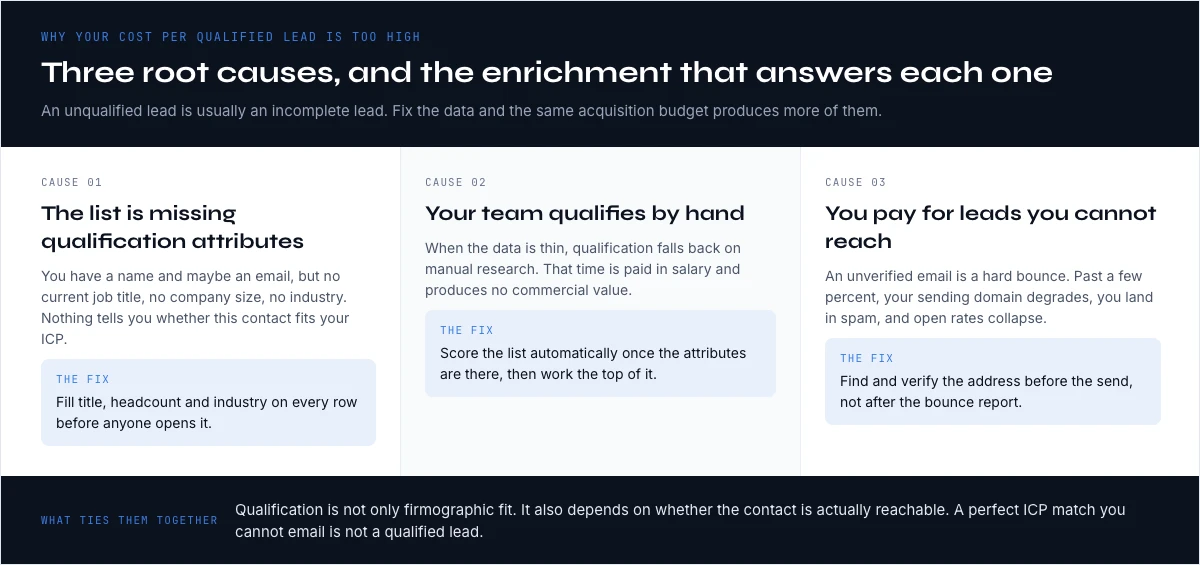
An unqualified lead is usually an incomplete lead. You have a name, maybe an email - but no current job title, no company size, no industry. Without that context, there's no way to know whether this contact fits your ICP without spending 10 minutes researching them manually.
According to Gartner, B2B data decays at a rate of 25 to 30% per year. A contact who fit your ICP 18 months ago has likely changed roles, functions, or companies. Without regular enrichment, you're prospecting on ghost data.
2. Your team qualifies manually - and that's expensive
When data is thin, qualification relies on manual research. HubSpot estimates that sales teams spend an average of 27% of their time on research and data entry tasks, instead of actually selling.
For a team of 5 SDRs at $50k/year each, that's roughly $67,500 in direct salary cost generating zero commercial value.
3. You're spending on leads you can't reach
An unverified email on a cold outreach list means a hard bounce. Once your bounce rate exceeds 3 to 5%, your sending domain's reputation degrades, your emails land in spam, and your open rate collapses. Result: your email budget generates fewer and fewer qualified leads for the same fixed cost.
Qualification isn't just about firmographic fit - it also depends on whether your contact data is actually reachable.
With those root causes clear, let's look at how data enrichment directly addresses each one.
The app works through your list row by row: 5 credits per email found, nothing is billed without a result.
How Data Enrichment Reduces Your Cost per Qualified Lead
Data enrichment means automatically completing your existing contacts with missing attributes: current job title, company size, industry, tech stack, verified email, direct phone number, and more.
Its impact on CPQL is mechanical: the more complete the data when a lead enters your pipeline, the faster, more accurate, and more automatable the qualification becomes. What used to take 10 minutes of manual research per lead drops to a few seconds.
Firmographic enrichment: qualify against the right ICP criteria
The first layer of enrichment targets company-level data (firmographics): headcount, industry, country, technology used, estimated revenue, founding year. These are typically the criteria that determine whether an account belongs in your ICP or not.
Without this data, you can't apply an automated filter. With it, you can route leads to the right rep, trigger the right outbound sequence, and automatically exclude out-of-scope accounts before they consume any human time.
Contact enrichment: reach the right decision-maker
Having the right account isn't enough. You need to reach the right person, through the right channel. Contact enrichment adds:
- Verified professional email: to avoid bounces and protect deliverability
- Direct phone number: for outbound call campaigns
- Exact job title and function: to personalize your messaging
- LinkedIn headline: to understand what the decision-maker is currently focused on
A Growth Marketer like Emma, at an 80-person SaaS scale-up, can go from a raw list of 500 LinkedIn contacts to 500 enriched contacts with verified email, job title, and company size - with the entire process automated in the Derrick web app or in Google Sheets.
Enrichment-based lead scoring: focus on the right opportunities
Once data is enriched, automated lead scoring becomes possible. Instead of prioritizing leads by arrival order, you assign each contact a score based on how closely they match your ICP.
For example: +20 points if the company has 50 to 500 employees, +15 points if the job title contains "Growth" or "Marketing", +10 points if the email is verified, -10 points if the industry is off-target. Leads above a defined threshold go straight to sales reps; the rest enter a nurturing sequence.
This mechanism mechanically reduces your CPQL: you only invest sales time in the prospects that deserve it.
How to Enrich Your Leads to Optimize Cost per Qualified Lead: Step-by-Step
Here's the concrete workflow for turning a raw list into a qualified, enriched pipeline.
Step 1: Define your ICP and qualification criteria precisely
Before enriching anything, list the attributes that define a qualified lead for your business. Typically:
- Company size (e.g., 20 to 500 employees)
- Target industries
- Decision-maker title or function (e.g., "Head of Growth", "Sales Ops", "VP Sales")
- Technology used (e.g., HubSpot, Salesforce, Google Sheets)
- Geography
Expected result: A weighted scoring grid you'll apply automatically after enrichment.
Step 2: Import your leads into the Derrick web app or Google Sheets
Whether your leads come from Sales Navigator, an inbound form, an event, or a CSV file, import them into the Derrick web app, or open them in Google Sheets. This is the working environment for everything that follows.
If you're importing from LinkedIn Sales Navigator, Derrick lets you pull a full list of profiles directly into the web app or your sheet with one click - no manual export or copy-pasting required.
Expected result: A spreadsheet with at minimum a LinkedIn URL or email column for each contact.
Step 3: Run profile and company enrichment
This is the core step. From a LinkedIn URL or email, Derrick automatically fills each row with the missing attributes: current job title, company, headcount, industry, verified email, phone number.
You access the lead enrichment feature directly from your Google Sheet, without switching tools or platforms.
For emails, Derrick's Email Finder locates the professional address and validates it in real time - eliminating bounce risk and protecting your sending domain from the start.
Expected result: Each contact now has 10 to 20 populated attributes, ready for scoring and personalization.
Step 4: Verify emails to protect your deliverability
Before any outreach, run your list through Derrick's Email Verifier. This step confirms that each address is valid, active, and not blacklisted.
Keeping your bounce rate under 2% is the baseline requirement for outbound campaigns to stay profitable. A mass hard bounce event can destroy months of domain reputation in a matter of days.
Expected result: A clean list with no invalid addresses, catch-alls, or spam traps.
Step 5: Apply your scoring and segment automatically
With enriched data in place, add a "ICP Score" column to your sheet. Use simple Google Sheets formulas - or Derrick's Ask Claude / Ask OpenAI feature - to assign points based on each criterion.
Segment your leads into three buckets:
- Hot (high score) → immediate handoff to sales reps
- Warm (mid score) → outbound nurturing sequence
- Out of ICP (low score) → archive or exclude
Expected result: Your sales reps only handle high-potential leads. Time spent per qualified lead drops. So does your CPQL.
Step 6: Measure the impact on your cost per qualified lead
Calculate your CPQL before and after enrichment:
CPQL before enrichment = Total spend ÷ Qualified leads (manual qualification) CPQL after enrichment = (Total spend + enrichment cost) ÷ Qualified leads (automated scoring)
In most cases, the volume of qualified leads increases significantly (because you were previously missing some), while qualification time drops - improving your CPQL even after factoring in the enrichment cost.
Expected result: A simple dashboard tracking CPQL evolution month over month.
The Most Effective Enrichment Levers by Acquisition Channel
Not all enrichment levers have the same impact depending on where your leads come from. Here's how to prioritize:
| Lead source | Priority missing data | Enrichment solution |
|---|---|---|
| Sales Navigator (LinkedIn import) | Verified email, phone, company size | LinkedIn Profile Scraper + Email Finder |
| Inbound form (name + email) | Job title, company, size, industry | Email Finder → firmographic enrichment |
| Event (badge scan, business card) | Everything (often just name + company) | LinkedIn Profile Finder → full enrichment |
| Outdated CRM file | Current job title, valid email | Email Verifier + LinkedIn re-enrichment |
| Web scraping (competitor site) | Decision-maker contact, email | LinkedIn Company Scraper → Profile Finder |
Effective B2B lead generation isn't just about volume - it's about data completeness from the moment a lead is captured.
Common Mistakes That Inflate Your Cost per Qualified Lead (and How to Fix Them)
Problem 1: Qualifying manually without enriched data
Impact: 20 to 30 minutes wasted per lead on research that generates zero commercial value. At team scale, that's several days per week of sales capacity down the drain. Fix: Automatically enrich every new lead as soon as it enters the system, before any human intervention.
Problem 2: Sending emails without prior verification
Impact: High bounce rate → domain reputation damage → lower open rates → cost per reply skyrockets. Fix: Make email verification standard before every outbound campaign. An unverified list of 1,000 contacts can contain 100 to 200 invalid addresses.
Problem 3: Scoring leads on a single criterion
Impact: A score based only on job title ignores company size, industry, or tech stack - three criteria that radically change a lead's relevance. Fix: Build a multi-criteria scoring model (firmographic + demographic + behavioral) powered by enriched data.
Problem 4: Not re-enriching regularly
Impact: With B2B job turnover at 20 to 25% per year, a lead list that's 12 months old is already partially obsolete. You're prospecting people who've changed roles or companies. Fix: Schedule a quarterly re-enrichment cycle on active lists, especially for job title and email data.
Problem 5: Conflating MQL and SQL in your CPQL calculation
Impact: An MQL (Marketing Qualified Lead) validated by marketing isn't necessarily a SQL (Sales Qualified Lead) ready for a sales cycle. Mixing the two distorts your CPQL and masks inefficiency in the marketing → sales handoff. Fix: Track MQL and SQL as separate metrics. Only calculate your CPQL at the SQL level, after enrichment and confirmed scoring.
Key Takeaways
- Cost per qualified lead measures the real cost of every prospect that fits your ICP - it's always higher than standard CPL, and it's the metric that actually matters.
- Incomplete or stale data is the #1 driver of a high CPQL: your team ends up qualifying manually what a tool should handle automatically.
- Data enrichment adds the missing attributes (job title, company size, verified email, phone) to enable automated qualification and scoring.
- An unverified email is a direct risk to your deliverability - and therefore to your real acquisition cost.
- Re-enriching your lists regularly matters as much as the initial enrichment: B2B data decays at 25 to 30% per year.
Conclusion: Enrichment Is the Cheapest Lever to Reduce Your CPQL
Cutting your cost per qualified lead doesn't always require a bigger acquisition budget. In most cases, the answer is simpler: make sure every lead entering your pipeline has the data needed to qualify it fast, accurately, and automatically.
Data enrichment is the most direct lever to get there. It turns a raw list into a structured, scored, prioritized pipeline - without adding manual work for your sales team.
Frequently asked questions
What's the difference between CPL and cost per qualified lead?
What's a good cost per qualified lead in B2B SaaS?
Does data enrichment actually improve CPQL?
How often should you re-enrich your lead lists?
Can lead qualification be fully automated?
Keep reading
Continue exploring this cluster


The 10 Essential KPIs to Measure Your B2B Data Enrichment
Read →

B2B Conversion Rate Impact: Case Studies and Concrete Levers
Read →

How Data Enrichment Shortens Your B2B Sales Cycle
Read →

SDR Productivity: The Measurable Gains You Can Actually Hit
Read →