
Data quality metrics: how to calculate and track them
Measure data quality metrics with 11 formulas, worked examples and a scorecard to copy. Test a 200-row B2B sample without an observability tool.
Data quality metrics are the numbers that say how far a dataset can be trusted for a given job. Most lists of them were written for data engineers watching warehouse tables and pipelines. The formulas carry over to any dataset, and they work just as well on the file a RevOps manager or a sales ops lead has to defend: contacts, accounts, emails and job titles in a CRM.
This guide gives you eleven data quality metrics, each with a definition, a formula and a worked number. Eight read a contact file and three read an incident log. You also get a scorecard to copy, a way to measure without buying an observability tool, and the cost of fixing what you find.
Every number in the examples is invented for this article: 200 B2B contact rows, the kind of export you would pull from a CRM on a Tuesday. For target bands on your routine checks, see the data hygiene thresholds. This page defines and calculates.
What are data quality metrics?
A data quality metric is a repeatable calculation that turns a vague worry ("the CRM is a mess") into a figure you can track over time. It has three parts: a rule that says what a good value looks like, a population it applies to, and a ratio or duration that comes out of the two.
Take "every contact should have a job title". The rule is that the field is not empty. The population is the contact rows you plan to use. The output is a percentage. Run the same calculation next month on the same population and you can say whether things improved.
Two properties separate a useful metric from a decorative one. It has to be reproducible, so two people running it on the same file get the same figure. And it has to be tied to a decision: if the number drops, somebody knows what they will do about it.
Why track these numbers at all?
Tracking data quality metrics turns symptoms such as low reply rates or distrusted reports into a measured cause with a specific fix, and it proves that a clean-up worked. Nobody gets a notification when a list loses accuracy. What you see instead are symptoms that look like other problems: a campaign with a poor reply rate, a rep who says the leads are bad, a territory report nobody believes. Without data quality metrics, each of those becomes a debate about opinions.
A measurement ends that debate and points to the right fix. A team with a 5% duplicate rate and a team with 30% stale records both say "our data is bad", yet one needs a merge and the other needs a refresh. Metrics also let you show that a clean-up worked, which is usually what it takes to get the next one funded.
Data quality metrics vs dimensions: what is the difference?
A dimension is the quality you care about, stated in words: accuracy, completeness, freshness. A metric is how you put a number on that quality in your context. The two words get used as synonyms, and that causes most of the confusion on this topic.
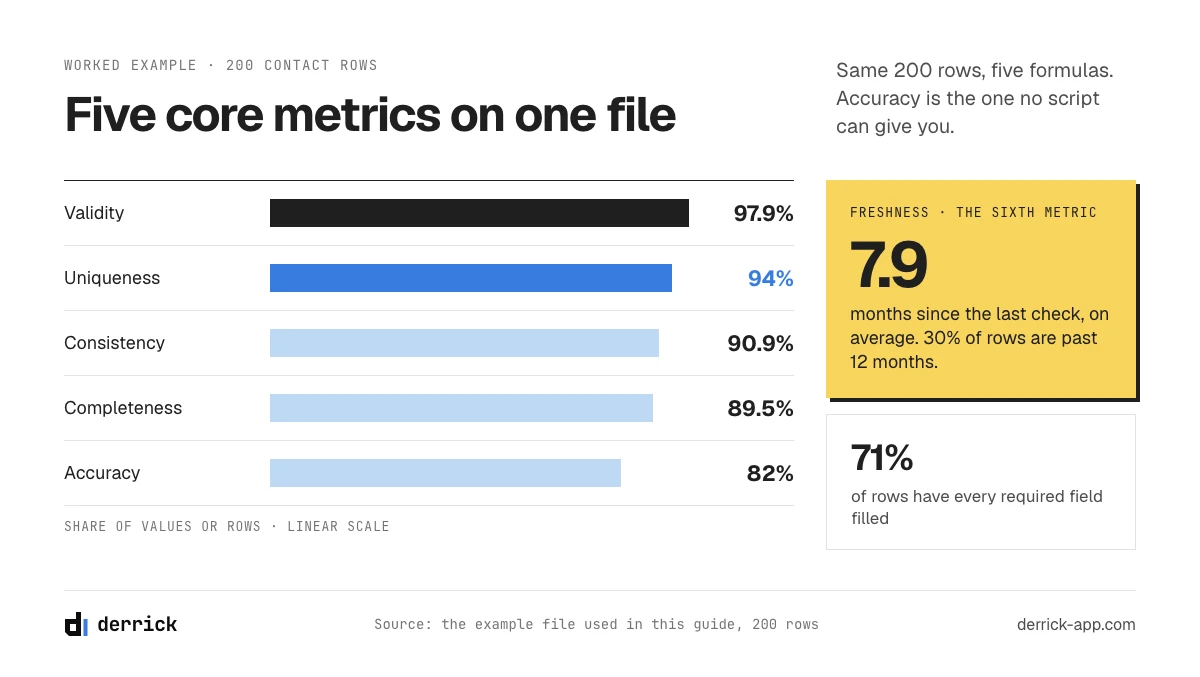
One dimension can produce several metrics. Completeness could be the share of filled cells across required fields, the share of rows with every required field filled, or the share of accounts with at least one reachable contact. All three are legitimate, and they give different answers on the same file. Our example file scores 89.5% on the first and 71% on the second (142 of 200 rows), because a single gap disqualifies a whole row.
That is why you should write the definition down before you publish a score. "Completeness is 90%" means nothing to a colleague until they know which of the three you ran. The six dimensions below are the ones you will meet most often, and the data quality management guide covers how they fit into a wider program.
The six core data quality metrics, with a formula for each
The examples in this section and in metrics 7 and 8 use the same invented file: 200 rows and four required fields (email, job title, company domain, country), so 800 expected cells. The formulas are the same on a warehouse table, where completeness becomes the null rate of a column and freshness the lag since the last load.
1. Completeness rate
Completeness rate is the share of required values that are present.
Formula: filled required cells / expected required cells.
Example: 716 of 800 cells are filled, so completeness is 89.5%. Look at the gaps field by field before you react, since 84 empty cells spread evenly and 84 empty job titles lead to very different plans. Only count fields your workflow really uses. Adding an optional "fax" column would lower the score and tell you nothing.
2. Validity rate
Validity rate is the share of filled values that respect the expected format.
Formula: filled values that pass a format rule / filled values.
Example: 701 of the 716 filled values pass, so validity is 97.9%. The 15 failures are things like "France" in a two-letter country column, or a domain typed with "https://" in front. Validity is the cheapest metric you will ever run, because a regular expression can do it. On its own it proves little: a well-formed email can still belong to someone who left in 2023.
3. Accuracy rate
Accuracy rate is the share of checked values that match the real-world fact.
Formula: values confirmed correct against a trusted source / values checked.
Example: you check 50 records by hand against the person's current profile and the company website, and 41 have the right title at the right company. That is 82%. No script can give you this number, because a machine can only tell you a value looks right, while accuracy asks if it is right. On 50 records the margin of error at 95% confidence is about 11 points either way, so report it as "roughly 71 to 93%" until you have checked more. For the field-by-field method, see our guide on what data accuracy means on a contact list.
4. Consistency rate
Consistency rate is the share of records whose related fields do not contradict each other.
Formula: records where linked fields agree / records where both fields exist.
Example: 164 rows have both an email and a company domain. In 149 of them the email domain matches the company domain, which gives 90.9%. The other 15 are worth opening: some are harmless (a parent company's email domain), others are people who changed jobs and kept an old address in the file. Other pairs to test are country against phone prefix, and company name against domain. Consistency is often the first metric to catch a stale record, because a job change breaks the link between two fields long before anyone updates either.
5. Uniqueness rate
Uniqueness rate shows how close the file comes to one row per real person or company.
Formula: distinct people / contact rows at contact level; distinct domains / distinct company names at account level.
Example: contact level first. 200 rows hold 188 distinct people, so uniqueness is 94%. Then run it again at account level, where most teams never look. The file shows 143 distinct company names but only 131 distinct domains, so 12 names are variants of a company already in the file ("Acme", "Acme Inc", "ACME SAS"). Account uniqueness is 131 / 143, or 91.6%. Two reps can work the same company for weeks because of that gap.
6. Freshness
Freshness, also called timeliness, says how long ago a record was last confirmed. Two figures describe it.
Formulas: average months since each record was last verified or enriched; records older than your cut-off / total records.
Example: 60 rows were touched about 2 months ago, 80 about 7 months ago and 60 about 15 months ago. The average age is 1,580 / 200, or 7.9 months, and 30% of rows are older than 12 months. Measure from the last real verification rather than the last edit: a CRM workflow that rewrites a field resets "last modified" without checking anything. The guide on keeping B2B data fresh explains why the right age differs per field.
In the web app or Google Sheets
Measure your valid email rate on a real sample
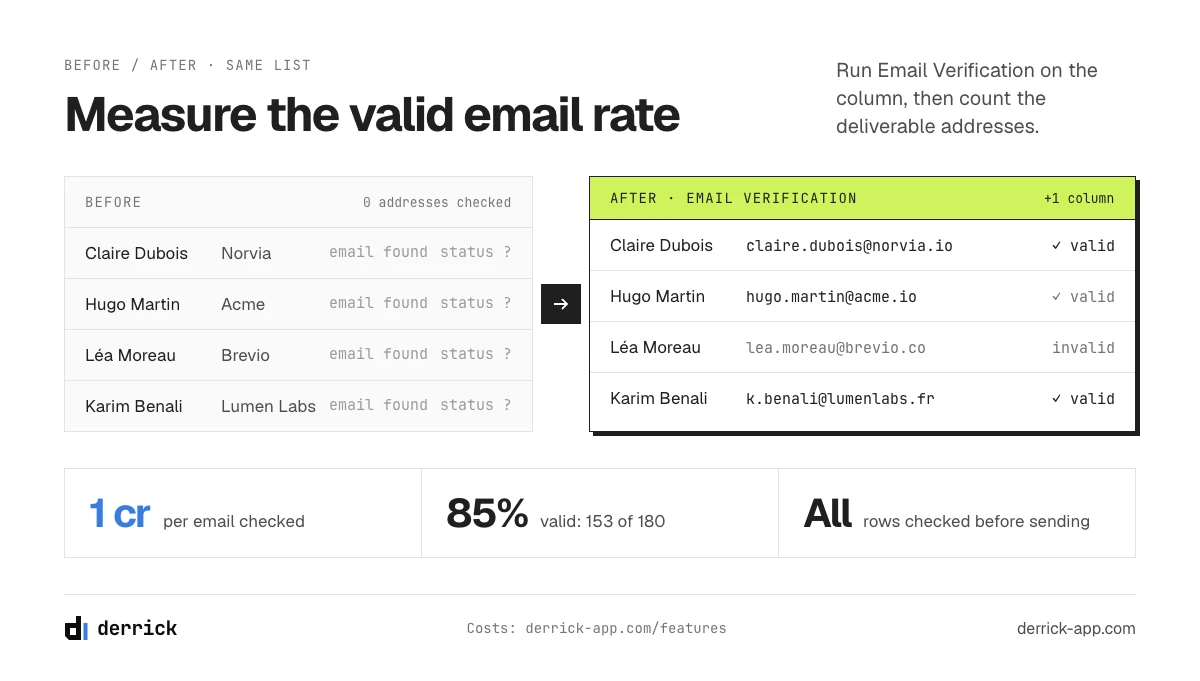
Of the metrics on this page, the valid email rate is the one you cannot compute by hand. Import your sample as a CSV in the Derrick web app, run the verification on the email column, and each address comes back with a status you can count for the scorecard.
- Feature
- Email Verification
- Credit cost
- 1 credit per verified
The first button opens the web app (nothing to install): 1 credit per verified, available from the STANDARD plan. The second details the feature and its cost per plan.
Advanced data quality metrics: reach, coverage and time to fix
The six core metrics describe the state of a file. These five describe what happens when you use it and how fast your team reacts to a problem. The first two read the same example file. The last three read an incident log, so their example is a separate scenario, invented as well.
7. Valid email rate
Valid email rate is the share of tested addresses that a verification confirms as deliverable.
Formula: addresses verified as deliverable / addresses tested.
Example: 180 rows have an email. Verification confirms 153 of them, so the valid rate is 85%. The other 27 split into 18 risky addresses and 9 dead ones. This differs from bounce rate, which you only learn after sending and after your sender reputation has paid for it. Verification gives you a good estimate before you send, and you decide how to treat the risky ones.
8. Coverage rate
Coverage rate is the share of empty cells an enrichment run manages to fill.
Formula: empty cells filled by an enrichment run / empty cells submitted.
Example: you submit the 84 empty cells and 52 come back filled, so coverage is 61.9%. Never read this alone. A provider can raise coverage by returning weak matches, which then lowers accuracy on the rows you thought you had fixed. The page on coverage rate vs accuracy rate shows how to test the two together.
9. Time to detection
Time to detection is how long a data problem stays unnoticed.
Formula: date a problem was noticed minus date it started.
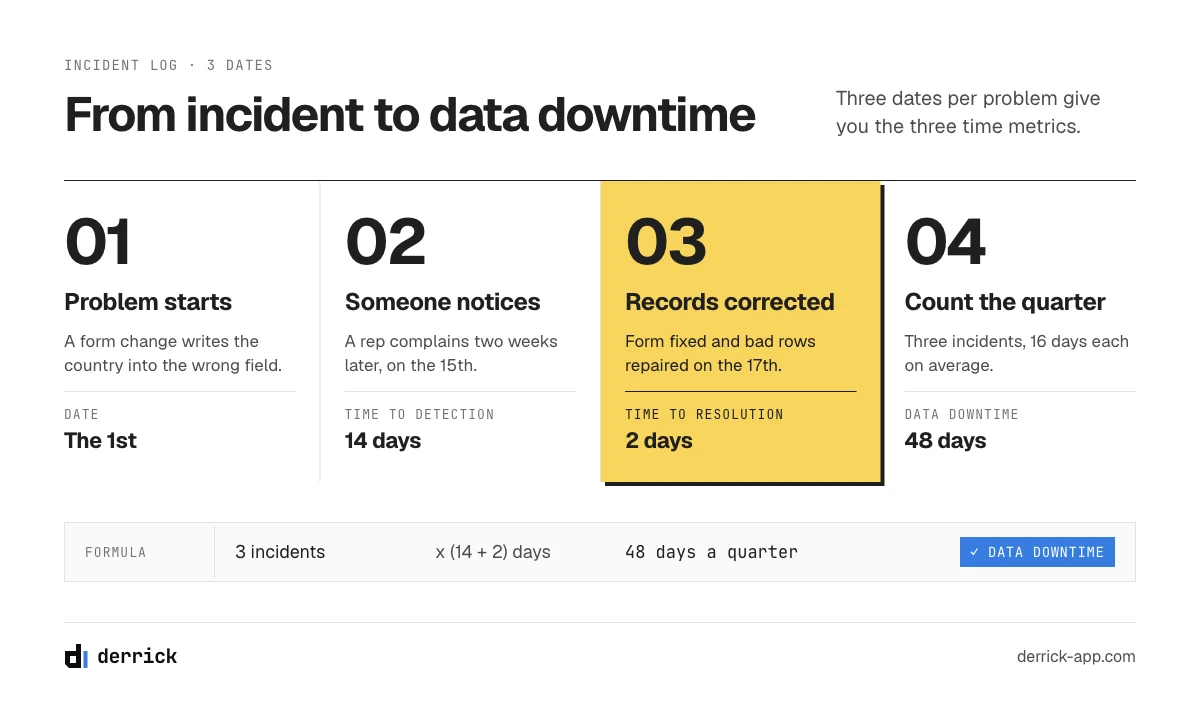
Example: a form change on the 1st starts writing the country into the wrong field. A rep complains on the 15th. Time to detection is 14 days, and it will stay there while your only alarm is a rep complaining. A validity check once a week would have capped it at seven days.
10. Time to resolution
Time to resolution is how long the damage stays in the base once someone knows about it.
Formula: date the affected records were corrected minus date the problem was noticed.
Example: the form is fixed and the bad rows repaired on the 17th, so time to resolution is 2 days. The closing date is when the records are corrected, not when the ticket is closed. Plenty of teams fix the cause and leave the damaged rows sitting in the base.
11. Data downtime
Data downtime is the total time during which part of your data could not be trusted.
Formula: number of incidents x (average time to detection + average time to resolution).
Example: three incidents in a quarter, averaging 14 and 2 days, make 3 x 16 = 48 days. Leaders tend to grasp this number at once, because "48 bad days last quarter" needs no explanation of what validity means.
How to measure data quality on a 200-row sample
You do not need an observability platform for this. Those tools make sense when you are watching hundreds of tables. For one CRM export, a spreadsheet and an afternoon give you seven of the eleven data quality metrics. Coverage comes with your next enrichment run, and the three time metrics come from a log you start today.
- Pull a random sample. Export 200 rows at random from the segment you actually use, such as active prospects. Avoid the first 200 by creation date, which over-represents old records. At 200 rows and 95% confidence, a percentage carries a margin of up to 7 points either way, and less for rates close to 100%. That is enough to see a real problem.
- Write down the required fields. Choose them from what your sequences and routing rules need. Four to six is normal.
- Count the empties and run the format rules. That gives you completeness and validity in a few minutes.
- Find the duplicates. In Google Sheets, the Find Duplicates feature flags repeated rows from the sidebar for free. Run it on email, then again on domain for the account view. It is the only Derrick step here that needs Google Sheets; email verification (step 5) runs in the Derrick web app.
- Verify the emails. Import the sample as a CSV in the Derrick web app and run Email Verification on the column. It needs a paid plan (from STANDARD, at €20 a month) and costs 1 credit per email checked: 180 x 1 credit for our file, 200 x 1 credit at most for a full 200-row sample. Every address tested is billed, invalid ones included.
- Test linked fields. Add a helper column that extracts the email domain, then compare it with the company domain.
- Check 50 records by hand. Allow about two minutes each, so a little under two hours. It is the only step that gives you real accuracy, so do not skip it.
- Read the age of each record. Use the last verification or enrichment date, then compute the average and the share past your cut-off.
- Open an incident log. Three dates per problem are enough: started, noticed, corrected. Your time metrics and data downtime come from there.
The tutorial below shows step 5, email verification, from import to sorted list.
The app works through your list row by row: 1 credit per verified.
A data quality metrics scorecard you can copy
Put the results in one table and keep it in the same place every month. The targets marked "starting point" are our suggestions for metrics that have no standard band, so adjust them after two or three readings. Where a line says "hygiene band", use the pass and fail figures in the data hygiene guide. They cover row-level completeness, the share of stale records and the other routine checks. One set of numbers means one verdict per file.
To see how your first reading compares with other files, our B2B data quality benchmarks give reference figures by field.
| Metric | Formula | Sample | Target | Owner, check |
|---|---|---|---|---|
| Completeness | Filled / expected cells; complete rows / rows | 89.5%; 71% of rows | Hygiene band, on rows | RevOps, monthly |
| Validity | Passing / filled values | 97.9% | Hygiene band | RevOps, once a week |
| Accuracy | Confirmed / checked | 82% | 85%, starting point | Sales ops, quarterly |
| Consistency | Agreeing / both present | 90.9% | 95%, starting point | RevOps, monthly |
| Uniqueness, contacts | Distinct / rows | 94% | Hygiene band | RevOps, monthly |
| Uniqueness, accounts | Domains / company names | 91.6% | 97%, starting point | RevOps, monthly |
| Freshness | Average age; share past cut-off | 7.9 months; 30% | Under 20% past cut-off, starting point | Marketing ops, monthly |
| Valid email rate | Deliverable / tested | 85% | 90%, starting point | Marketing ops, before each send |
| Coverage | Filled / submitted | 61.9% | Hygiene band | RevOps, each enrichment |
| Time to detection | Noticed minus started | 14 days | Under 7 days, starting point | Data owner, per incident |
| Time to resolution | Corrected minus noticed | 2 days | Under 5 days, starting point | Data owner, per incident |
| Data downtime | Incidents x (detection + resolution) | 48 days a quarter | Down each quarter, starting point | Data owner, once a quarter |
If you need a single figure, weight the percentages by what they cost you when they slip. For an outbound team we would use accuracy 30%, valid email 20%, completeness 20%, then 10% each for uniqueness, consistency and validity. On our example, using cell completeness and contact uniqueness:
(82 x 0.3) + (85 x 0.2) + (89.5 x 0.2) + (94 x 0.1) + (90.9 x 0.1) + (97.9 x 0.1) = 87.8, so about 88 out of 100. With accuracy measured on 50 records, that score can move about 3 points either way. Note what it hides: only 71% of rows are complete, a level the data hygiene guide treats as a stop-and-fix reading, and the composite still looks comfortable.
Treat that composite as a summary. It can stay flat while accuracy falls and validity rises, so keep the table underneath it. Freshness and the time metrics stay out because months and days do not average with percentages, and coverage stays out because it grades an enrichment run rather than the file.
Data quality KPIs: what to report upward
The difference between a metric and a KPI is the audience. You can track eleven data quality metrics in your operations review. Leadership needs three at most, each tied to something they already care about.
- Valid email rate, because it protects deliverability on every campaign you send.
- Accuracy on the active segment, because it decides how much of a rep's day goes to the wrong person.
- Data downtime, because it counts how many days the team worked from data it could not rely on.
Report the trend against last quarter and name the fix you funded. A sentence such as "valid email went from 85% to 93% after we began verifying before each send" (our example, not a benchmark) is one a CFO can use.
How to implement data quality metrics: baseline, owners, frequency, alerts
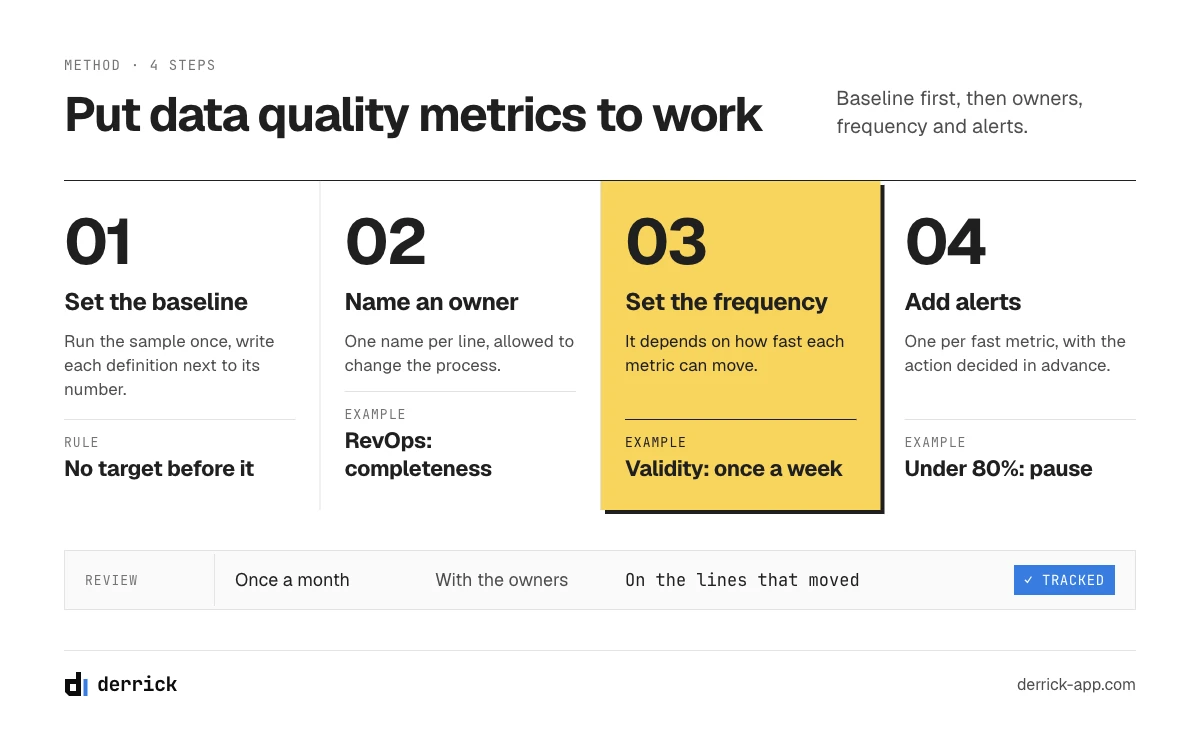
Start with a baseline: run the sample once, write each definition next to its number, and do not set a target before you have that first reading. Add automation afterwards, starting with the format rules, since they are the cheapest to run on a schedule.
Then set the frequency, which depends on how fast each metric can move and what a bad reading costs. Format errors can arrive overnight from one broken form, so validity deserves a check once a week, ideally automated. Accuracy costs hours of human time and drifts slowly, so once a quarter is usually enough. The valid email rate belongs right before each campaign, since that is the moment it pays off.
Each line of the scorecard needs one name, and that person needs to be allowed to change the process that causes the problem. A common split: RevOps owns structural metrics such as completeness, validity and uniqueness. Marketing ops owns what touches sending. Sales ops or a team lead owns the accuracy check, since reps feel that one first.
Finally, set one alert for each metric that can change quickly, and decide in advance what happens at each level. For example, on the valid email rate: below 90% someone reviews the list, below 80% the sequence pauses until the list is verified again. Those two figures are starting points to adjust. Review your data quality metrics once a month with the owners, and spend the time on the lines that moved.
Five ways these numbers mislead you
- Measuring the whole base instead of the segment you use. A file of 100,000 rows with 20,000 dormant records can look terrible while your active prospects are fine, or the reverse. Score what you actually send to.
- Using a metric as a target. If you reward coverage, people will accept weak matches. Pair coverage with accuracy so that one cannot rise at the expense of the other.
- Changing the definition silently. Add a required field in March and completeness drops in March, with no change in the data. Note every definition change next to the score.
- Trusting a confidence score as if it were accuracy. A vendor's confidence score predicts how likely a value is to be right, so it cannot replace checking a sample by hand.
- Stopping at the score. Decide which fix each metric triggers (merge, normalize, verify, enrich, re-check) before you start.
What each fix costs
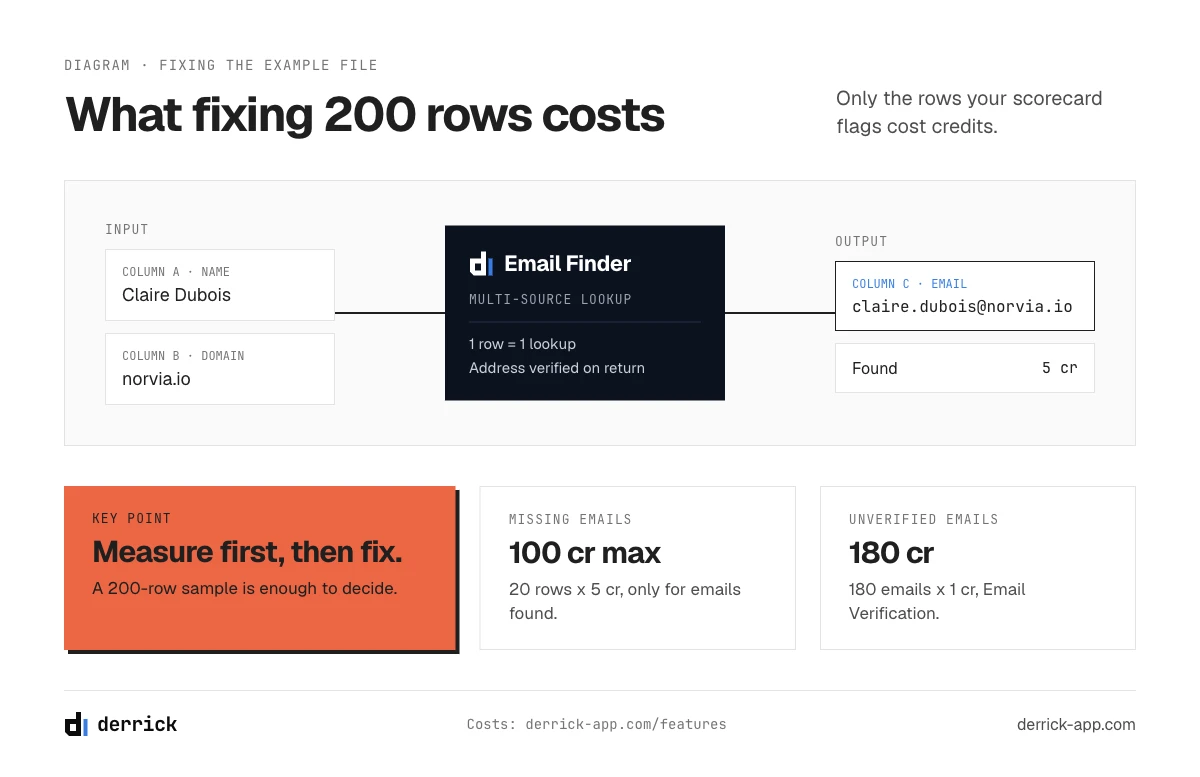
On the 200-row example, the full fix comes to 180 x 1 credit for verification, at most 20 x 5 credits for the missing emails and 60 x 1 credit for the stale titles, plus about three hours of manual work. Here is what correcting the example file's problems involves, and how the same work scales to 10,000 rows. That table is usually the basis of the budget request.
| Problem | Action | On 200 rows | On 10,000 rows |
|---|---|---|---|
| Duplicates | Find Duplicates in Google Sheets, then merge | Free, about 30 minutes of merging | Free, merging depends on the rate found |
| Format failures | Normalize with a rule at intake | About 15 minutes | One rule, the same work |
| Unverified emails | Email Verification, 1 credit per email | 180 x 1 credit | Up to 10,000 credits, the monthly allowance of the STANDARD plan at €20 |
| Missing emails | Email Finder (paid plans, from STANDARD at €20), which already verifies the address it returns | At most 20 x 5 credits, for the 20 rows with no email; you pay only for emails found | 10% of rows empty would mean at most 1,000 x 5 credits |
| Missing company fields | Enrich Companies, with your LinkedIn account connected through the Chrome extension, available on the FREE plan | 1 credit per company to complete | The same rate per company |
| Wrong titles | Enrich Leads on records past your cut-off, with LinkedIn connected, available on the FREE plan | 60 x 1 credit, for the 60 rows older than 12 months | 30% of rows would mean 3,000 x 1 credit |
| Proving the fix | New manual check on a sample | 50 records, about 2 hours | The same 50 records: the sample does not grow with the file |
The last row often surprises people. The size of a reliable sample barely depends on the size of the base, so 200 rows tell you nearly as much about a file of 10,000 as about one of 100,000. Measuring stays cheap at any volume, while correcting grows with the file. So measure first, then spend on the segment that brings in revenue.
Key takeaways
Write the definition next to every number, or next month's comparison will be worthless.
Start with the six core data quality metrics, then add valid email rate, coverage and the time metrics once the first scorecard exists. A random 200-row sample and a spreadsheet are enough to begin. The 50 manual checks take the most effort, and they are the only direct measure of accuracy.
Finally, give each line an owner and decide what happens the day it drops. Once your first reading is done, the B2B data cleansing loop is the natural next read.
Frequently asked questions
What are the main data quality metrics?
What is the difference between data quality metrics and dimensions?
How do you measure data quality?
What is data downtime?
How large should a data quality sample be?
What are the most important data quality KPIs?
How often should you measure data quality metrics?
Do you need a data observability tool to track data quality?
Keep reading
Continue exploring this cluster


The B2B Data Decay Benchmark 2026: How Fast Your Data Goes Stale
Read →

How to Measure the Quality of Your Enriched Data: The Complete Guide
Read →

Data Freshness: How Often Should You Refresh Your B2B Data?
Read →

Coverage Rate vs Accuracy Rate: Understanding B2B Enrichment Metrics
Read →