Last updated: 2026-06-18
B2B marketing in 2026 is a tale of widening gaps. The distance between top-quartile teams and the median is growing on almost every metric that matters: cost per lead, conversion by channel, funnel efficiency, speed to lead. This report pulls the 2026 benchmarks into one place and argues that the single most underpriced lever behind the gap is not a channel or a tactic, it is the quality and freshness of the contact and account data feeding every campaign. Clean data is the multiplier that makes the rest of the numbers move.
The thesis is deliberately not "data is everything." Channels, creative, and offer all matter. The point is narrower and more useful: no amount of channel optimization rescues a campaign aimed at contacts who are unreachable, and a meaningful share of most B2B databases is exactly that. Fix the data and every downstream metric in this report improves at once; ignore it and you optimize tactics on top of a leak.
The 2026 benchmark picture
The headline numbers tell a consistent story of rising cost and rising dispersion. Market data for 2026 puts the median B2B cost per lead in the low hundreds of dollars and climbing year over year, with wide variation by sector. Conversion rates by channel remain low in absolute terms, organic and email outperform paid search and paid social on conversion, while newer referral sources are emerging. The pattern across every metric is the same: the median drifts while the top quartile pulls away.
What separates the two groups is rarely a secret channel. Top-quartile teams run broadly the same playbook as everyone else; they execute it on cleaner inputs. A campaign with a strong offer and creative still underperforms if a fifth of the list bounces, and the cost-per-lead math gets worse with every dead contact you paid to reach. The benchmark you should care about is not the market median but your own cost per reachable, qualified lead.
This reframes benchmarking itself. Comparing your CPL to a market median is only useful if your data is as clean as theirs, and it usually is not the variable anyone controls for. The more actionable comparison is before-and-after on your own funnel once the data is verified, which is the lens the rest of this report takes. The lead-generation economics behind CPL are covered in the lead generation guide.
The dispersion itself is the story worth dwelling on. When a market median drifts while the top quartile pulls away, it usually means a capability is compounding for some teams and not others. In 2026 that compounding capability is operational, not creative: the teams pulling ahead have made their data reliable and their response fast, so every incremental dollar of spend reaches more real people than their competitors' does. Creative parity is easy to reach; operational parity is where the gap actually lives.
The funnel: MQL to SQL
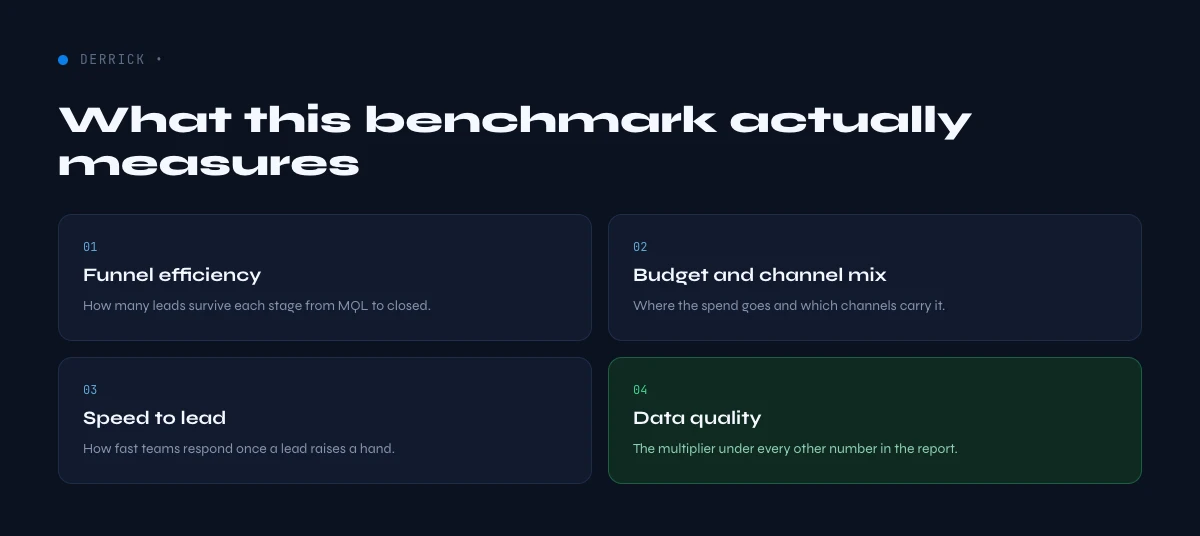
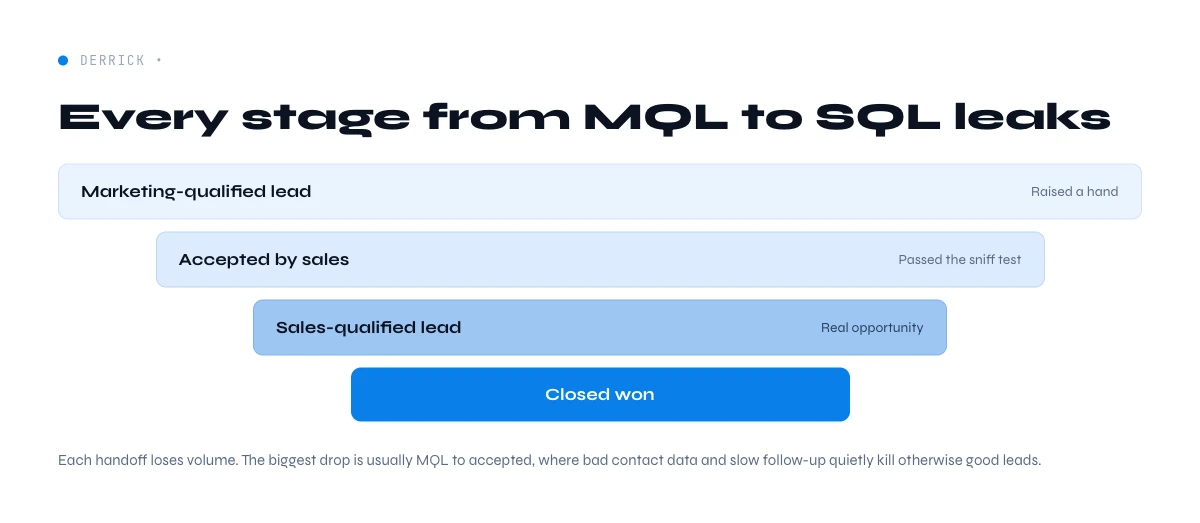
The clearest illustration of the top-quartile gap is the MQL-to-SQL conversion. Market data puts the median somewhere around the low teens in percentage terms, while top-quartile teams convert at roughly double that. The gap is not mostly about lead volume; it is about lead quality and what happens to a lead in the minutes and hours after it is created. The teams that win the conversion are the ones that act on accurate, enriched records fast.
Three things distinguish the high converters: disciplined scoring, fast routing, and enriched data underneath both. Scoring is only as good as the firmographic and contact data it runs on; routing is only as fast as your ability to reach the right rep with a complete record; and both collapse if the underlying email or phone is wrong. A lead that scores well but cannot be reached converts at zero, regardless of how good the scoring model is.
So the funnel gap is, in large part, a data gap wearing a process costume. The median team treats data quality as a back-office concern and optimizes the funnel mechanics; the top quartile treats verified, enriched data as the input that makes the funnel mechanics work. Improving MQL-to-SQL usually starts with making sure the M in MQL is reachable and correctly described, not with another scoring tweak.
It is worth being concrete about how a dirty list taxes the CPL math. If you pay to generate a hundred leads and a fifth are unreachable, your true cost per usable lead is a quarter higher than the number on the dashboard, before any conversion difference. That hidden markup applies to every channel at once, which is why teams that fix data see improvement across the whole report rather than in one place. The leak is upstream of the channel split.
Budget and channel mix
Marketing budgets in 2026 hover around the high single digits as a share of revenue, under pressure to prove return, and the mix is shifting. Spend is moving from broad demand generation toward account-based motions, intent-led targeting, and AI-assisted execution, all of which concentrate effort on fewer, better-chosen accounts. That concentration raises the stakes on data: when you bet more budget on fewer accounts, being wrong about those accounts costs more.
This is the quiet trap in the ABM and intent shift. The more precisely you target, the more the result depends on the contact data for the specific people in the specific accounts you chose, and the less a large top of funnel cushions a bad list. A precise motion on stale data is worse than a broad one, because precision amplifies whatever data you point it at, correct or not.
So the budget trend and the data argument reinforce each other. As spend concentrates on ABM and intent, verified, enriched account and contact data stops being a hygiene task and becomes the thing that determines whether the concentrated bet pays off. The strategic choice of where to spend is covered in the account-based marketing guide and the broader trade-offs in the inbound vs outbound guide.
Scoring deserves a second look here because it is where dirty data does the most invisible damage. A scoring model trained and run on incomplete or stale firmographics will confidently mis-rank leads, sending good ones to nurture and bad ones to sales, and no one will see the error because the model still outputs a tidy score. Garbage in, confident garbage out. The fix is not a better model but better inputs, which is exactly the unglamorous work the median team skips.
Speed to lead
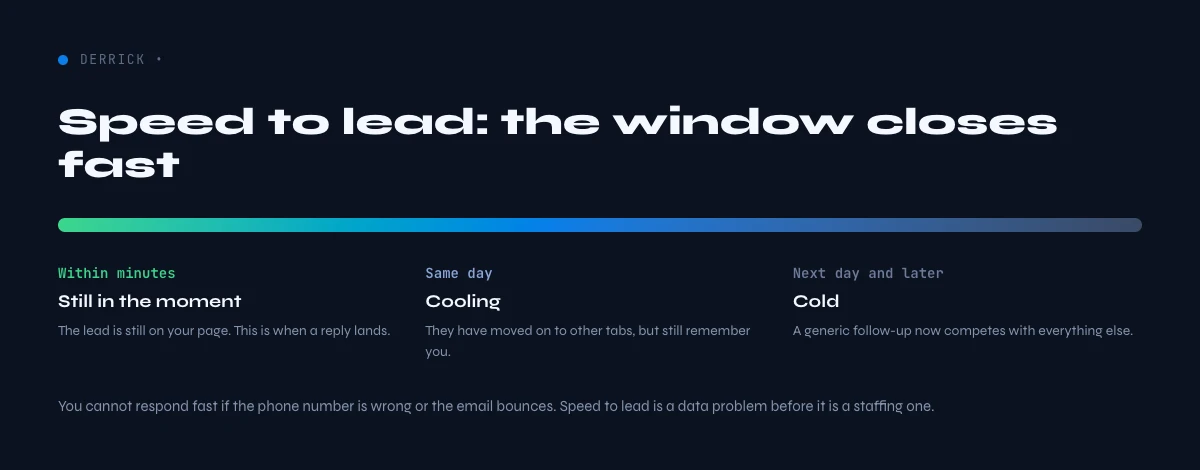
Few levers in B2B are as well documented as speed to lead. Research on lead response has long shown that contacting a new inbound lead within the first few minutes multiplies the odds of qualifying it, by an order of magnitude compared to waiting hours. The window is short and the decay is steep: a lead contacted in five minutes converts dramatically better than the same lead contacted an hour later.
But speed only works if the contact details are right. The entire advantage of a five-minute response collapses if the phone number is wrong or the email bounces, because the fast attempt simply fails fast, which quietly inflates the real cost behind every generated lead. Worse, teams optimizing for speed on a dirty list generate a burst of bounces and dead dials that looks like activity and produces nothing, while degrading sender reputation in the process.
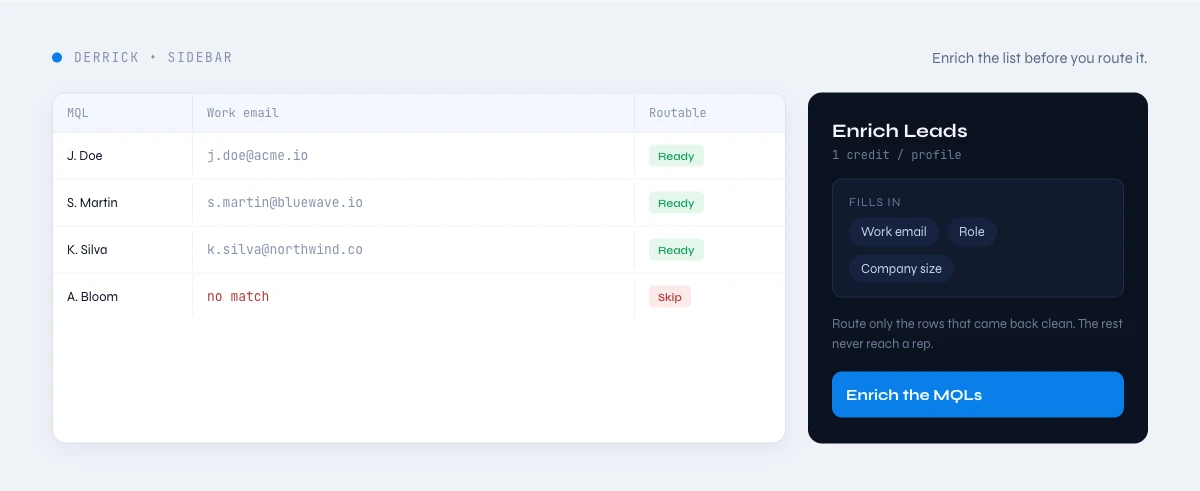
This makes data quality the silent precondition for the speed-to-lead lever everyone chases. Verifying and enriching a lead the moment it arrives, so the first fast attempt lands on a real, current contact, is what turns the speed advantage from theoretical into real. Speed and data freshness are not two separate initiatives; the first depends entirely on the second.
The AI shift compounds all of this. As more execution moves to AI-assisted personalization and routing, the models amplify whatever data they are given, so a clean base makes AI a force multiplier and a dirty one makes it an error multiplier at scale. The teams getting real returns from AI in 2026 are not the ones with the best prompts, they are the ones feeding their AI accurate, current data, which loops back to the same lever as everything else in this report.
Data as the multiplier
Pull the threads together and one pattern holds across every metric in this report: clean data is the multiplier, not a separate line item. A better channel, a tighter funnel, a faster response, a more precise ABM list, each of these only delivers its benchmark return if the underlying contact data is accurate and current. When a meaningful share of a database is wrong, and in B2B that share is rarely small, every campaign run against it loses that fraction off the top before any optimization even applies.
This is exactly where Derrick fits, and it is upstream of the channel question entirely. Before budget goes to a campaign, Derrick verifies emails and phone numbers and enriches contact, company, and LinkedIn data directly inside Google Sheets, so the list you launch on is reachable and correctly described. It is not a channel tool and does not compete with your marketing stack; it makes the data that stack runs on trustworthy, which is what lets the benchmarks in this report actually materialize. Clean data is not an IT project, it is the multiplier on every marketing KPI here.
Reliabilize your campaign data at the source with Derrick, free for 100 credits per month, directly in Google Sheets. Run a campaign-ready check, verified email, found phone, enriched account, before the budget goes out, and measure the lift against your own prior benchmarks. The full demand-gen view starts from the B2B marketing hub.
There is also a measurement payoff to fixing data first. Most marketing experiments are noisy because the underlying list quality varies between tests, so you cannot tell whether a creative change or a list change moved the number. Verify the data before the test and you remove a major confound: differences in results become attributable to the variable you actually changed. Clean data does not just lift the KPIs, it makes the KPIs trustworthy enough to optimize against.
One more reframing helps when presenting this to a board. Every benchmark in this report is a ratio with spend on the bottom and outcomes on top, and bad data quietly inflates the denominator and shrinks the numerator at the same time: you pay to reach contacts who are not there, and you lose the conversions you would have won. Cleaning the data improves both halves of every ratio at once, which is why it shows up as broad, durable lift rather than a single-metric bump, and why it is the rare marketing investment that compounds rather than decays.
Methodology and sources
This report aggregates 2026 B2B marketing benchmarks from non-vendor, generalist sources: Gartner and Forrester on marketing budgets and the state of B2B buying; Salesforce State of Marketing for channel and team trends; McKinsey and Harvard Business Review for data-driven marketing return; and published market data for cost-per-lead and channel-conversion ranges. Benchmark figures are presented as 2026 market data and normalized into comparable ranges; where a conversion or CPL number could only be traced to a data or outreach vendor's marketing, we did not cite it. The data-quality cost framing draws on the same primary research used across this report series.
A closing thought for a CMO. The instinct under budget pressure is to optimize the channel mix, squeeze CPL, and chase the next tactic. Those efforts are real but bounded, because they all sit on top of the same input: the data you point them at. The highest-leverage, least-glamorous move in 2026 is to make that input trustworthy before the budget moves, so every channel, every campaign, and every fast response lands on a real, current contact. Do that and the benchmarks in this report stop being someone else's numbers and start being yours.
Frequently asked questions
What are the key B2B marketing benchmarks in 2026?
What separates top-quartile teams?
Why does data matter more in ABM/intent?
Is speed to lead enough?
How does Derrick improve marketing KPIs?
Continue exploring this cluster
Start enriching your sheet in 30 seconds
Free for 100 credits/month. No credit card.
Install Derrick free →