B2B data glossary Definition

B2B Marketing Attribution: Models, Examples and How to Set It Up

B2B attribution is the method of giving each marketing touchpoint a share of the credit for the pipeline and revenue it helped create. In B2B, deals take months and involve several buyers, so teams use multi-touch attribution models and count credit per account, not per lead. The model matters less than the data underneath: a contact that is not linked to the right account cannot be attributed to anything.

Updated
Try the app free
or use it in
Google Sheets
Claude
API
4.6 / 5 on Google Workspace Marketplace4.5 / 5 on G2254 upvotes on Product Hunt
Part 1 / 7

Definition

Definition: B2B Marketing Attribution

B2B Marketing Attribution is the process of determining which marketing actions and channels are contributing to sales and conversions in business-to-business contexts. In B2B marketing, attribution is crucial for understanding the effectiveness of various marketing efforts across complex sales cycles that often involve multiple touchpoints and decision-makers. By accurately attributing conversions to specific marketing activities, businesses can optimize their strategies, allocate resources more effectively, and enhance their overall ROI. This process involves analyzing data from digital marketing channels, such as email, social media, and paid advertising, alongside sales automation tools to provide a comprehensive view of how marketing efforts impact sales outcomes. Effective B2B marketing attribution helps organizations identify which channels and campaigns drive the most valuable interactions, enabling them to refine their approach for better lead generation and nurturing.

Part 2 / 7

How it works

How B2B Marketing Attribution works

B2B marketing attribution answers one question: which marketing actions helped turn a company into a customer, and by how much? It takes every recorded interaction between a buying company and your brand (an ad click, a webinar, a download, a demo request, a sales email reply), links each one to the deal it belongs to, and splits the value of that deal across those interactions with a set of rules. That set of rules is the attribution model. If you need the general definition first, our page on marketing attribution covers the basics; this page is about how it works when the buyer is a company.

Every attribution setup, simple or advanced, runs the same three steps:

  1. Collect the touchpoints. Each interaction is recorded with a date, a channel, a campaign and, above all, the person who did it. Web visits carry UTM tags, form fills create or update a contact, events and calls are logged in the CRM. A touchpoint that is not recorded does not exist for the model.
  2. Connect touchpoints to deals. Each person is matched to a company, and each company to its opportunities. This is where B2B gets hard: the analyst who read your guide, the manager who joined your webinar and the CFO who signed are three different contacts, and they only add up to one journey if all three are linked to the same account record in the CRM.
  3. Split the credit. The attribution model decides how the value of each closed or open deal is shared across the touchpoints that came before it. Add up the credit by channel or campaign over a quarter and you get the number marketing actually needs: pipeline and revenue per channel, which you can compare with what each channel costs.

Most of the effort in attribution goes into steps 1 and 2. Step 3 is a setting in a report. Teams that argue for weeks about which model to choose, while a third of their contacts have no company attached, are working on the wrong step.

Why B2B attribution is different

Attribution was first built for online shops, where one person sees an ad, clicks and buys within a few days. B2B breaks almost every assumption behind that picture:

  • The sales cycle is long. A B2B deal often takes several months, sometimes more than a year, between the first visit and the signature. Many tools only look back a few weeks by default, so the touches that started the journey fall out of the window before the deal closes.
  • Several people buy together. A purchase usually involves a buying committee: the future users, their manager, someone from IT or security, finance and the person who signs. Each one has their own touchpoints with you. Look at only one of them and you see a fragment of the journey.
  • The unit is the account, not the lead. In B2C the customer and the buyer are the same person. In B2B the customer is a company, and revenue is booked against that company. Attribution has to roll up the touchpoints of every person at the account, which means each contact must be attached to the right company in the first place.
  • A lot happens out of sight. Buyers read posts without clicking, forward articles in private chats, listen to podcasts and ask peers for advice. This dark social layer leaves no trace in your tracking, so no model can credit it directly.
  • Offline still matters. Trade shows, dinners, partner referrals and sales calls shape many deals. They only count if someone logs them in the CRM against the right contact and account.
  • Sales and marketing both touch the deal. A reply to a sales email, a call booked by an SDR and a demo run by an account executive sit next to marketing touches in the same journey. If the model ignores sales activity, marketing looks bigger than it is; if it ignores marketing, sales looks like it did everything alone.
  • Few deals, high value. A B2B team may close dozens of deals a quarter, not thousands of orders a day. Small numbers make statistical models fragile and make each wrongly attributed deal weigh more in the totals.

None of this makes attribution useless in B2B. It means the model has to work at the account level, look back far enough, include sales activity, and be read with judgement rather than as an exact truth.

The 7 B2B attribution models compared

There are seven attribution models you will meet in almost every B2B tool and report. They fall into three families: single-touch models (all credit to one touchpoint), rule-based multi-touch models (credit shared with fixed weights) and data-driven models (weights learned from your own history). For each one below: how the credit is split, when it fits, and its limit in B2B. A deeper look at the mechanics of each rule is on our page about the marketing attribution model.

  • 1. First-touch attribution. How the credit is split: 100% goes to the first recorded interaction with the account, for example the first visit from a LinkedIn ad. When to use it: to see which channels bring new companies into your world, when your main goal is awareness in a new market. Limit in B2B: it ignores everything that happened over the months that followed, and the "first" touch is often just the first one you managed to record.
  • 2. Last-touch attribution. How the credit is split: 100% goes to the final interaction before the conversion you measure (the demo request, the opportunity, the signature). When to use it: to understand what pushes buyers over the line, or as a starting point when your data is thin. Limit in B2B: it rewards bottom-of-funnel channels such as branded search and demo pages, and makes the content and events that created the interest look worthless.
  • 3. Linear attribution. How the credit is split: equal shares for every touchpoint in the journey. Ten touches, 10% each. When to use it: as a first multi-touch attribution model, when you want to see every channel that took part without arguing about weights. Limit in B2B: a newsletter open counts as much as a two-hour workshop, and long journeys spread the credit so thin that every channel looks average.
  • 4. Time-decay attribution. How the credit is split: touches closer to the conversion get more credit, touches further back get less, often by halving the weight every few weeks. When to use it: for shorter B2B cycles, or when you mainly want to know what speeds up deals already in progress. Limit in B2B: it pushes down the early touches that started the relationship, which is where much of the long-term value of content and brand sits.
  • 5. U-shaped (position-based) attribution. How the credit is split: 40% to the first touch, 40% to the touch that created the lead (usually the first form fill), and the remaining 20% shared across the touches in between. When to use it: when your two key moments are getting noticed and getting a contact on file. Limit in B2B: it stops caring after the lead is created, so everything that moves the deal from lead to opportunity to signature gets little credit.
  • 6. W-shaped attribution. How the credit is split: 30% to the first touch, 30% to the lead-creation touch, 30% to the touch that created the opportunity, and 10% shared across the rest. Some teams add a fourth milestone, the closed deal, and call it full-path. When to use it: it is often the best default for B2B because it follows the milestones the pipeline is built on. Limit in B2B: it depends on clean milestone dates in the CRM; if opportunities are created late or by hand without a date, the weights land on the wrong touches.
  • 7. Data-driven (algorithmic) attribution. How the credit is split: a statistical model compares journeys that converted with journeys that did not and gives more credit to the touches that show up more often in the winning paths. When to use it: when you have a large history of won and lost deals, consistent tracking across channels and someone who can explain the output. Limit in B2B: with a few dozen deals a quarter the model has little to learn from, its weights move a lot from one month to the next, and nobody outside the data team trusts a number they cannot explain.

A simple rule for choosing: start with a rule-based multi-touch attribution model that your sales and finance colleagues can understand in one sentence, usually W-shaped or linear, and keep first touch and last touch as side views. Move to a data-driven model only once your volume and data quality can carry it. Our page on multi-touch attribution goes further into the rule-based options.

Which attribution model fits your situation

The right attribution model depends less on theory than on three facts about your business: how long your deals take, how many you close, and how reliable your milestone data is. Use the situations below as a starting point.

  • You are a young company with little data. Use first touch and last touch side by side, plus the self-reported source field. Two simple views you trust beat one sophisticated view nobody understands. Revisit once you have a few quarters of closed deals.
  • You sell to companies with cycles of a few weeks. A time-decay attribution model or a linear one works well, because the journey is short enough that recent touches carry most of the decision.
  • You run long cycles with a clear funnel. When leads and opportunities are created in the CRM with reliable dates, W-shaped is usually the best fit. It credits the moment a company noticed you, the moment someone raised a hand and the moment sales took over.
  • You sell to a short list of named accounts. Report at the account level first, whatever the model. Engagement per account and roles reached per account matter more than how a single deal is split.
  • You have a large history and a data team. Test a data-driven attribution model against your rule-based reference for a few quarters. Keep the rule-based view until the two agree on the big picture and the team can explain the differences.

Whatever you choose, show at least two models in the same report. When first touch and W-shaped tell the same story about a channel, you can act on it. When they disagree, you have found the question worth discussing with sales.

Account-based attribution

Account-based attribution groups every touchpoint from every person at a company into one journey per account, then attributes the deal to that combined journey. It is the B2B answer to the buying committee problem, and the natural partner of account-based marketing, which is why many teams simply call it ABM attribution.

Here is what changes when you switch from contact-level to account-level attribution:

  • The journey gets longer and more complete. Instead of the five touches of the person who filled in the form, you see the forty touches of the six people who took part in the decision, including the ones who never filled in anything.
  • Influence becomes visible. Content read by the CFO two weeks before signature, or a webinar attended by the head of IT, now shows up in the deal's history. Contact-level models miss it because those people are not the lead.
  • The question changes. You stop asking "which campaign generated this lead?" and start asking "which campaigns reached the people who decide at our target accounts, and did those accounts move?". That is the question account-based programs need answered.
  • You can measure before the deal. Account-level reporting shows engagement per target account (people reached, roles reached, recent activity) even before an opportunity exists, which helps sales decide where to focus.

The price of account-based attribution is the data work. It only works if each contact is matched to the correct company: same spelling, same domain, the current employer and not the last one, and no duplicate account records splitting the history in two. Personal email addresses, job changes and companies with several brands or subsidiaries are the usual traps. This matching step decides whether account-based attribution shows you the real committee or a scattered set of strangers.

Attribution maturity: where to start

Attribution is not a project you finish in one go. Most B2B teams move through three levels, and trying to jump to the last one without the first two is the most common way to waste a year.

  1. Level 1: consistent basics. Every campaign uses the same UTM naming rules, every form writes the source and campaign to the contact, every contact is linked to a company, and every opportunity has a creation date and a source. Reporting uses first touch and last touch side by side, plus a required "How did you hear about us?" field on demo forms. This level alone answers most budget questions for a young team.
  2. Level 2: multi-touch at the account level. Marketing automation and CRM are synced, touchpoints are rolled up to accounts, sales activity is logged, and a rule-based multi-touch model (linear or W-shaped) becomes the shared reference. The lookback window matches your real sales cycle. Marketing and sales agree on definitions and review the numbers together each quarter.
  3. Level 3: tested and combined. The team has enough history to try a data-driven model, compares attribution with other methods such as incrementality tests (pausing a channel in some regions and measuring the difference) and buyer surveys, and uses account signals to steer spend before deals exist. At this level attribution is one input among several, not the single truth.

If you are not sure where you stand, take a sample of twenty recent deals and check by hand whether each one has its contacts attached to the right account and its key dates filled in. If more than a few fail, you are at level 1, whatever your tools say.

Metrics to track

Attribution produces credit; the metrics below turn that credit into decisions. Track them per channel and per campaign, over a period long enough to cover your cycle.

  • Sourced pipeline. The value of opportunities where the channel got the first-touch or lead-creation credit. It shows which channels open new deals.
  • Influenced pipeline. The value of opportunities where the channel had at least one touch before the opportunity was created. It shows which channels take part, even if they do not start the journey.
  • Attributed revenue. The share of closed-won revenue assigned to the channel by your chosen model. This is the number finance cares about, and the slowest to come in.
  • Cost per opportunity. Channel spend divided by the opportunities it is credited with. Easier to compare across channels than cost per lead, because leads vary so much in quality.
  • Pipeline-to-spend ratio. Attributed pipeline divided by spend over the same period. A quick way to rank channels, as long as you remember that pipeline is not revenue.
  • Target-account engagement. The share of target accounts where you reached at least two or three people from the buying committee. The leading signal for account-based programs.
  • Time to opportunity. The average time between first touch and opportunity creation, per channel. It tells you which channels bring buyers who are ready and which ones bring buyers who need nurturing.
  • Unattributed share. The share of pipeline with no recorded touch, or with contacts not linked to an account. This is your data-quality metric: when it grows, every other number becomes less reliable.

Add the customer acquisition cost per channel once you have enough closed deals, and always read these numbers next to the "How did you hear about us?" answers, which catch what tracking misses.

Set it up in 5 steps

A working B2B marketing attribution setup does not need a large budget. It needs the steps below, in this order, because each one depends on the one before.

  1. Clean the CRM data first. Attribution can only be as good as the records it reads. Merge duplicate contacts and companies, attach every contact to its company, update job titles and employers for the people who moved, and fill in the basic company fields (domain, industry, size) so accounts can be grouped and matched. Decide who owns each field and how new records are created, so the data does not drift again. Our guides on CRM data enrichment and data quality management cover this step in detail.
  2. Choose the model and the window. Pick one main attribution model (W-shaped or linear for most teams) and one or two side views (first touch and last touch). Set the lookback window to cover your typical cycle, plus a margin. Write the choice down in one paragraph, with the reason, and share it with sales and finance before the first report goes out.
  3. Standardize tracking. Agree on UTM naming rules (source, medium, campaign, content) and enforce them in every link, ad and email. Make sure every form passes those values to the contact record. Create a simple way for sales and event teams to log offline touches (events, calls, referrals) against the contact and account.
  4. Link contacts to accounts and touches to opportunities. Match each new contact to an existing company by domain and name, flag the ones that cannot be matched, and add contact roles on opportunities so the right people count toward the deal. This is the step that turns lead-level attribution into account-level attribution.
  5. Review, compare and adjust. Look at the results each month for trends and each quarter for decisions. Compare the model with the self-reported source field and with sales feedback on recent deals. When they disagree, check the data before you question the model. Change the model only if the business has changed, not because a channel owner dislikes their number.

Part 3 / 7

Examples

Real-world examples

The examples below are illustrations written by us. The companies, people and amounts are fictional and the figures are not benchmarks. They show how the same deal reads under different attribution models, and what happens when the data underneath is wrong.

Example: one deal, five touchpoints, seven ways to share the credit

A software company closes a $60,000 annual contract with a mid-sized logistics firm. Over five months, the CRM records five touchpoints from three people at that firm:

  1. Month 1, first touch. An operations analyst clicks a LinkedIn ad and reads a blog article.
  2. Month 2. The analyst's manager attends a webinar on warehouse planning.
  3. Month 3, lead created. The analyst downloads a planning template and fills in the form. A contact is created.
  4. Month 4, opportunity created. The manager replies to an email from a sales rep and books a demo. The rep opens an opportunity.
  5. Month 5, last touch. The CFO reads a customer case study and visits the pricing page a week before signing.

Here is how the $60,000 is shared under each model (example figures):

  • First touch: the LinkedIn ad gets $60,000; the four other touches get nothing.
  • Last touch: the case study and pricing visit get $60,000; the four others get nothing.
  • Linear: each of the five touches gets 20%, so $12,000 each.
  • Time decay (example weights of 10%, 15%, 20%, 25% and 30%): $6,000 for the ad, $9,000 for the webinar, $12,000 for the template, $15,000 for the sales email and $18,000 for the case study.
  • U-shaped: 40% to the ad ($24,000), 40% to the template that created the lead ($24,000), and the remaining 20% shared by the webinar, the sales email and the case study ($4,000 each).
  • W-shaped: 30% to the ad ($18,000), 30% to the template ($18,000), 30% to the sales email that created the opportunity ($18,000), and 10% shared by the webinar and the case study ($3,000 each).
  • Data-driven: no fixed split. The weights depend on how often each type of touch appears in your past won deals compared with your lost ones, so the result could not be computed from a single deal.

The same deal can make the paid social team look like it produced the whole contract, or nothing at all. That is why the choice of model must be written down and shared before the numbers are used in a budget meeting, and why it is worth showing two views side by side.

Example: the same deal with contact-level data

Now imagine the same company runs attribution at the contact level, only on the person who filled in the form. The journey shrinks to two touches: the LinkedIn ad and the template download, both from the analyst. The webinar (the manager), the sales email (the manager again) and the case study (the CFO) disappear from the deal, because those people are not the lead. Under a linear model, the ad and the template now get $30,000 each, events and customer stories get zero, and next quarter the webinar program looks like a cost with no return. Nothing about the deal changed, only the unit of analysis. Switching to account-based attribution brings the three missing touches back.

Example: three teams, three reading habits

Three fictional teams look at the same kind of report and draw different conclusions, depending on how they read it.

  • The team that reads one model. A marketing lead presents last-touch numbers only. Branded search and the demo page get most of the credit, so the team cuts its content budget. Two quarters later, fewer new companies come into the funnel and branded search drops too, because the content was what made people search for the brand in the first place.
  • The team that reads two models. Another team shows first touch and W-shaped side by side. Its podcast gets little credit under W-shaped but appears often as a first touch at large accounts. Instead of cutting it, the team adds a clear next step after each episode and tracks whether those accounts move to an opportunity within a few months.
  • The team that reads the data before the model. A third team notices that a large share of its pipeline has no source at all. Before discussing models, it checks a sample of those deals by hand and finds that most of them involve contacts with no company or an old employer. It fixes those records, and the channel ranking changes more than any model switch would have changed it.

Example: when the data breaks the model

Take the account-level version and add one ordinary data problem: the manager who attended the webinar changed jobs a year ago, and the CRM still lists him at his previous employer. His webinar registration, his reply to the sales email and his demo are all filed under the wrong company. The logistics firm's journey now shows only the analyst and the CFO, the opportunity looks like it came from nowhere, and the W-shaped model gives the opportunity-creation credit to no touch at all.

Multiply that by every contact with an old job title, a missing company or a duplicate account, and a significant part of the pipeline ends up with no credible source. No model can fix this. The fix is upstream: keep employers and job titles current, attach every contact to the right company, and merge duplicates before the quarter's numbers are read. That is the least visible part of attribution and the one that decides whether anyone trusts the report.

Part 4 / 7

Why it matters

Why B2B Marketing Attribution matters in 2026

B2B marketing budgets are under closer watch than ever, and the question finance asks has not changed: what did we get for this money? Attribution is how marketing answers with numbers rather than opinions. It matters more now for four reasons.

  • Budget decisions need evidence. Without attribution, the channels that look busy (lots of clicks, lots of leads) win the budget, while the ones that quietly help close large deals lose it. With it, you can compare channels on pipeline and revenue and move money with a reason you can explain.
  • Journeys are longer and more scattered. Buyers research alone, across more channels, and talk to vendors later. Many now ask AI assistants to summarize the options before they visit a single site. The more scattered the journey, the more you need a method that adds up the pieces instead of crediting only the last click.
  • Buying committees keep growing. When more people weigh in on each purchase, a report that tracks one lead per deal misses most of the decision. Account-level attribution is the only way to see whether you reached the people who actually decide.
  • Tracking is getting harder. Browser privacy rules, blocked cookies and consent banners mean fewer web touches are recorded. That makes the CRM, where touches are tied to known contacts and accounts, the most reliable source you have, and the quality of its records more important.

Attribution and sales and marketing alignment

Attribution is as much an agreement between teams as a report. When marketing and sales use different definitions of a lead, an opportunity or a source, every quarterly review turns into a debate about whose number is right. A shared model settles most of that debate in advance: both teams agree on which milestones count, how sales touches are recorded next to marketing touches, which window is used and who fixes a record that is wrong. Sales activity should sit inside the model, not outside it, so that an SDR's call and a webinar are seen as parts of the same journey. Teams that set this up together, often with the help of revenue operations, stop arguing about credit and start discussing what to do next. Our page on sales and marketing alignment covers the wider process.

The main challenges of attribution in B2B

  • Incomplete CRM data. Contacts with no company, duplicate accounts, old job titles and missing opportunity dates are the first reason attribution reports are wrong. They are also the easiest to underestimate, because the report still shows numbers, just the wrong ones.
  • Correlation is not causation. Attribution shows which touches came before a deal, not which ones caused it. A buyer who was always going to buy may click a retargeting ad on the way; the ad gets credit it did not earn. To test cause, you need experiments such as pausing a channel in one region or for one segment and comparing the results.
  • Invisible touches. Dark social, word of mouth, podcasts and offline conversations rarely appear in the data. A required free-text source field on demo forms and questions in the first sales call are the cheapest ways to recover part of that picture.
  • Windows that are too short. Default lookback windows of a few weeks cut off the start of a B2B journey. Set the window from your real cycle, measured from your own closed deals.
  • Different systems, different truths. Ad platforms, web analytics, marketing automation and the CRM each count conversions their own way. Pick one system as the reference for attribution, usually the CRM, and treat the others as inputs.
  • People gaming the model. Once credit drives budget, channel owners have a reason to tag more touches or argue for the model that favors them. Agree on the rules before the numbers come out and review them only on a fixed rhythm.

When attribution is not worth it

Formal attribution has a cost: tracking work, data cleaning, tools and review time. In some situations, that cost is higher than what you learn from it.

  • Very small volume. If you close only a handful of deals per quarter, a model has too little to work with, and talking to each new customer about how they found you tells you more.
  • Very short cycles. When buyers decide within days, often alone, simple last-touch or channel reports are usually enough.
  • One dominant channel. If almost all your pipeline comes from one source, such as a partner or outbound, the question attribution answers is already answered.
  • Incomplete CRM data. If contacts are not linked to companies and opportunities have no dates, a multi-touch model will produce precise-looking numbers on a broken base. Fix the data first, then model.

In these cases, keep the basics (UTM rules, a source field, first and last touch) and invest in attribution later, when volume and data can carry it.

What a useful attribution report looks like

A good report fits on one page and answers a decision, not a curiosity. For each channel it shows the spend, the sourced and influenced pipeline, the attributed revenue under the main model, and the same figure under one side view, over a period at least as long as your cycle. Below the table of numbers, three short notes explain what changed since the last review, which data problems affect the figures (for example the share of deals with no source), and what the team proposes to do: keep, increase, test or stop each channel. Leadership should be able to read it in five minutes and see the reasoning, not just the totals. If a report needs a meeting to be understood, the model is too complex for the decisions it supports.

Getting the data right

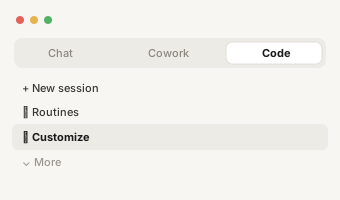
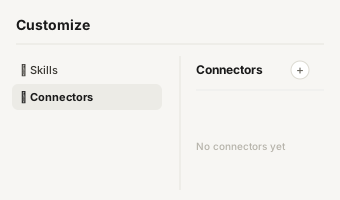
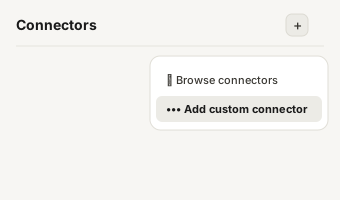
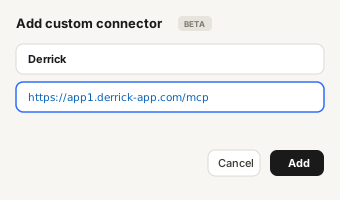
Account-level attribution only works when each contact carries a current job title and is attached to the right company, and each company has a domain, an industry and a size. Teams that keep those records complete through lead enrichment see more of each buying committee in their reports. In the Derrick web app, Enrich Leads updates a person's current company and role from their profile, and Enrich Companies adds the firmographic fields used to group and match accounts. The same functions run from the Google Sheets sidebar, in Claude through the Derrick MCP or through the API.

One email every 2 weeks on go-to-market and sales tactics: subscribe to the Fill Down newsletter.

Part 5 / 7

Tools

B2B Marketing Attribution & Derrick: tools to operationalize

Derrick is the data layer behind your marketing ops: pull accounts, enrich them with firmographics, segment by ICP and export the result to your CRM or ad platform.

Browse the enrichment workflows →
Part 6 / 7

Common mistakes

Common mistakes

  • Leaving contacts without an account. A contact that is not attached to a company, or attached to the wrong one, drops out of the account journey. Its touches credit nothing, and the deal looks like it came from fewer channels than it did. Check the share of unlinked contacts before every quarterly review.
  • Confusing correlation with causation. A touch that appears in many won deals did not necessarily cause them. Retargeting ads and branded search are the classic examples: they meet buyers who were already coming. Use attribution to compare and question, and use tests when a budget decision depends on the answer.
  • Choosing the model before fixing the data. Weeks spent comparing W-shaped and data-driven models are wasted if a large share of contacts has no company and opportunities have no creation date. Clean first, model second.
  • Measuring leads instead of accounts. Crediting only the person who filled in the form hides the rest of the buying committee and makes events, content and sales touches look weaker than they are.
  • Using a lookback window shorter than the cycle. If your deals take six months and your window is a month, the touches that started the journey never get credit.
  • Treating the model as the truth. Every model is a set of rules chosen by people. Read it next to self-reported sources and sales feedback, and present the results as a view, not a verdict.
  • Changing the model every quarter. Each change breaks the comparison with past periods. Pick a model, write down why, and revisit it once a year unless the business changes.

Why teams choose Derrick.

Powerful features that save time and boost your sales pipeline.

ENRICHMENT

100+ data points on companies & leads.

AI POWERED

Built-in AI, no separate subscription.

FOUR SURFACES

The web app, Google Sheets, your AI assistant, or the API.

BEST VALUE

Same quality data, for a fraction of the cost.

From a search to a campaign, in one place

The four steps Derrick covers in the web app, and the features behind each one.

Any questions?

Stop copying data around. Start enriching.

What is the best attribution model for B2B?

+
For most B2B teams, a W-shaped model is the best default, because it gives credit to the three milestones the pipeline is built on: first touch, lead creation and opportunity creation. Linear is a good alternative when milestone dates are unreliable. Data-driven models only make sense with a large history of won and lost deals.

Why do traditional attribution models fail in B2B?

+
They were built for one buyer who decides quickly online. B2B deals take months, involve a buying committee of several people, include offline and sales touches, and are booked against a company rather than a person. Models that look at one lead and a short window miss most of the journey.

What is the difference between B2B marketing attribution and multi-touch attribution?

+
B2B marketing attribution is the overall practice of crediting marketing for B2B pipeline and revenue. Multi-touch attribution is one family of models within it, where the credit is shared across several touchpoints instead of going to a single one. Most B2B teams use multi-touch models, ideally at the account level.

What is account-based attribution?

+
Account-based attribution, also called ABM attribution, groups the touchpoints of every person at a company into one journey and attributes the deal to that combined journey. It shows the influence of the whole buying committee, but it only works if each contact is linked to the correct company in the CRM.

How long should the attribution window be in B2B?

+
The window should cover your real sales cycle plus a margin. Measure the average time between first touch and closed-won on your own recent deals, then set the window above it. For many B2B teams that means several months to more than a year, far longer than the default settings of most tools.
Start enriching LinkedIn profiles today

Open the Derrick web app, import a LinkedIn search or your own list, nothing to install. The free plan gives you 100 credits every month, no credit card.

Try the app free
or use it in
Google Sheets
Claude
API
100 credits free every month
1 credit per LinkedIn profile imported
5 credits per email found (paid plans)