Last updated: 2026-06-18
Most teams treat company data as a one-time purchase: buy a firmographic file, load it, and move on. The data behaves nothing like that. Company attributes, the industry, the headquarters, the headcount, the legal status, drift continuously as the real world reorganizes underneath them. This report puts numbers on the health of B2B company data in 2026: how fast firmographics decay, the structural forces driving it, what a stale company record actually costs, and why coverage and accuracy are not the same thing.
The conclusion is not that company data is worthless, far from it. It is that company data is a flow, not a stock. A record you re-verify at the moment you use it beats a record you bought a year ago and never refreshed, no matter how complete the original file looked. The teams that win on firmographics are the ones that treat freshness as a process rather than a purchase.
How fast firmographic data decays
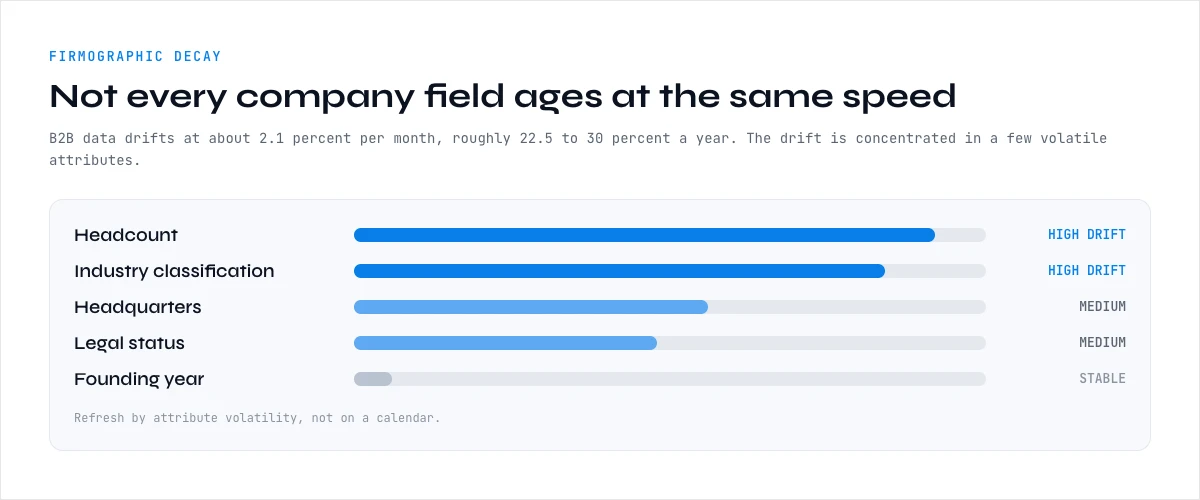
B2B contact data is known to decay at roughly 2.1 percent per month, compounding to about 22.5 to 30 percent per year, and firmographic data is subject to the same drift, attribute by attribute. The decay is not uniform: some company fields are far more perishable than others. Headcount changes constantly as firms hire, lay off, and reorganize. Industry classification drifts as companies pivot or get reclassified. Headquarters and legal status change with relocations, mergers, and restructurings. Founding year is one of the few genuinely stable attributes.
This attribute-by-attribute variation matters because it tells you what to refresh and how often. Treating every field as equally durable is the mistake: a record can have a perfectly stable founding year and a wildly out-of-date headcount and industry at the same time, which means a record that looks accurate on the fields you happen to check can be wrong on the fields that actually drive routing and targeting.
The practical consequence is that a firmographic file has a shelf life measured in months, not years, on its most useful fields. A database enriched a year ago is, on the volatile attributes, roughly a quarter wrong, and nobody notices until segmentation, scoring, or territory assignment quietly starts working off bad inputs. The per-attribute detail for industry is in the company industry classification guide.
It helps to picture the decay as a portfolio rather than a single rate. If you hold a hundred thousand company records, the volatile fields are losing accuracy every month while the stable ones hold, so the file does not gently fade, it splits into a part that is still trustworthy and a growing part that quietly is not. Without measurement you cannot tell which record is in which half, which is why an unmanaged file feels fine right up until a campaign or a territory plan hits the wrong half at scale.
The four structural drivers
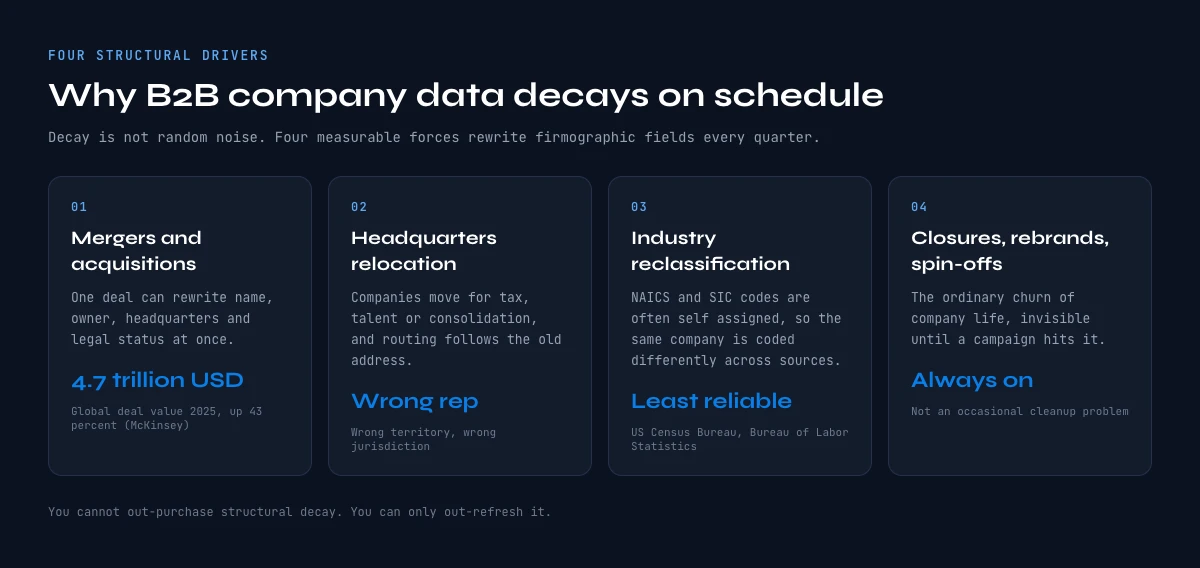
Firmographic decay is not random noise; it is driven by measurable, structural forces. The first is mergers and acquisitions. According to McKinsey, global M&A deal value rose 43 percent in 2025 to 4.7 trillion dollars, up from 3.3 trillion the year before, with technology and media leading at a 61 percent jump to 1.1 trillion. Every one of those deals can change a company's name, ownership, headquarters, and legal status at once, invalidating multiple firmographic fields in a single event.
The second driver is headquarters relocation, as companies move for tax, talent, or consolidation reasons. The third is industry reclassification: the NAICS and SIC systems that underpin most industry tagging are often self-assigned and inconsistently applied, so the same company can be coded differently across sources and over time, making industry one of the least reliable firmographic fields. US Census Bureau and Bureau of Labor Statistics work on industry coding underscores how much classification can shift. The fourth is the ordinary churn of closures, rebrands, and spin-offs.
Put together, these four forces mean firmographic decay is structural and ongoing, not an occasional cleanup problem. The volume of M&A alone, at record levels, guarantees that a meaningful slice of any company database is wrong within months of being built. You cannot out-purchase this; you can only out-refresh it. The location-specific angle is covered in the headquarters location guide.
What a stale company database really costs
The cost of stale firmographics is larger than it looks because it propagates. Gartner estimates poor data quality costs organizations an average of 12.9 million dollars per year, and firmographic errors are a prime contributor because they feed everything downstream. A wrong industry code misroutes a lead and breaks segmentation. A wrong headcount puts an account in the wrong tier and the wrong territory. A wrong headquarters sends it to the wrong rep and, in regulated outreach, the wrong jurisdiction.
Beyond misrouting, there is the direct time cost: reps and ops spending hours re-verifying company details by hand, which is non-selling, non-analytical work. And there is the forecast cost: territory plans, account scores, and capacity models built on firmographics that are a quarter wrong produce plans that are quietly wrong too. The error does not announce itself; it shows up as a missed number that gets blamed on execution rather than on the data underneath.
The compounding nature is the real danger. A single wrong field is cheap; the same wrong field replicated across scoring, routing, territory, and forecast is expensive, because every system that consumes it inherits the error. This is why firmographic accuracy is not a data-team nicety but a revenue-operations fundamental, and why the cost of letting it decay is almost always underestimated.
This also reframes how to think about a data provider's age. A file refreshed last quarter is not "recent" on headcount or industry, those fields have already moved; it is only recent on the stable attributes. The question to ask a provider is not when the file was last built but how it handles the volatile fields between builds, because that is where the real accuracy gap opens up and where a static model has no good answer.
Coverage versus accuracy
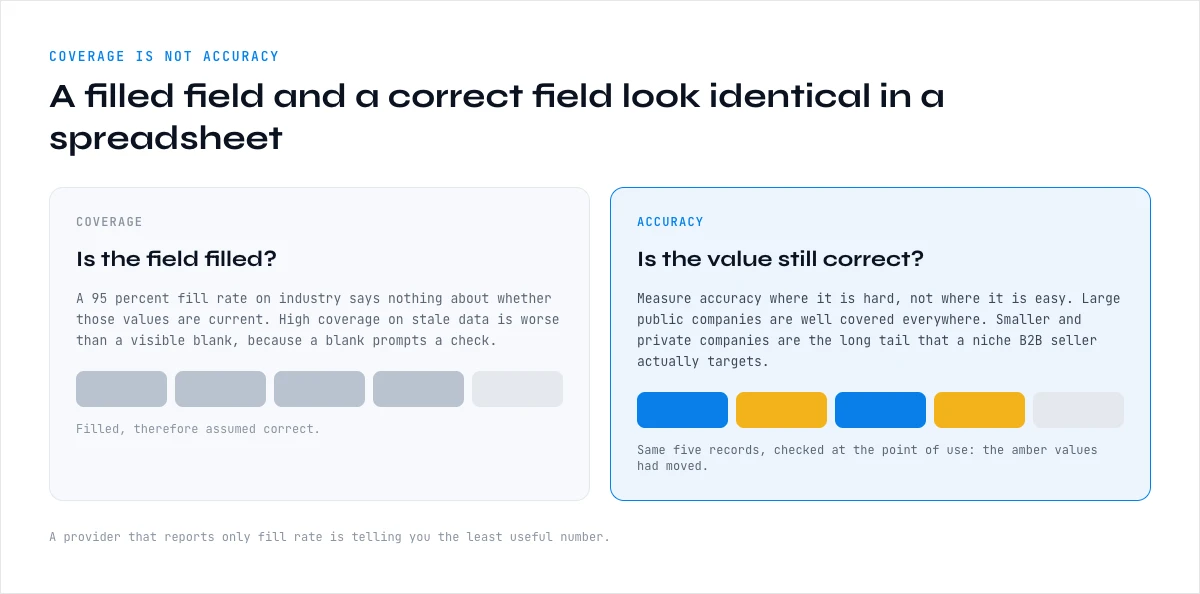
The most common mistake in evaluating company data is confusing coverage with accuracy. Coverage is whether the field is filled; accuracy is whether the value is correct. A firmographic file can boast a 95 percent fill rate on industry and still be wrong on a large share of those filled values, because a confidently populated but outdated or mis-classified field looks identical to a correct one in a spreadsheet. High coverage on stale data is arguably worse than a visible blank, because the blank prompts a check and the wrong value does not.
Fill rates also vary widely by company size and sector. Larger, public companies are well covered across sources; smaller and private companies, and certain sectors, are far harder to get right, so a headline fill rate hides a long tail where the data is both sparse and unreliable. Aggregated industry studies consistently show this pattern: coverage looks strong in aggregate and collapses in the segments that are hardest to reach, which are often exactly the ones a niche B2B seller cares about.
The lesson is to measure accuracy, not just coverage, and to measure it where it is hard rather than where it is easy. A vendor or a database that reports only fill rate is telling you the least useful number. What matters is how often the filled value is actually correct and current on the attributes and segments you target, which is a question you can only answer by verifying against a live source at the point of use.
The territory and routing example deserves spelling out because it is where finance feels the decay most directly. Account scoring and territory design are usually run once or twice a year off a firmographic snapshot. If headcount and industry on that snapshot are a quarter wrong, then a meaningful share of accounts are scored into the wrong tier and routed to the wrong rep for the entire planning period, and the cost is not a one-time error but a structural misallocation that compounds across every quarter until the next refresh.
The living-data thesis
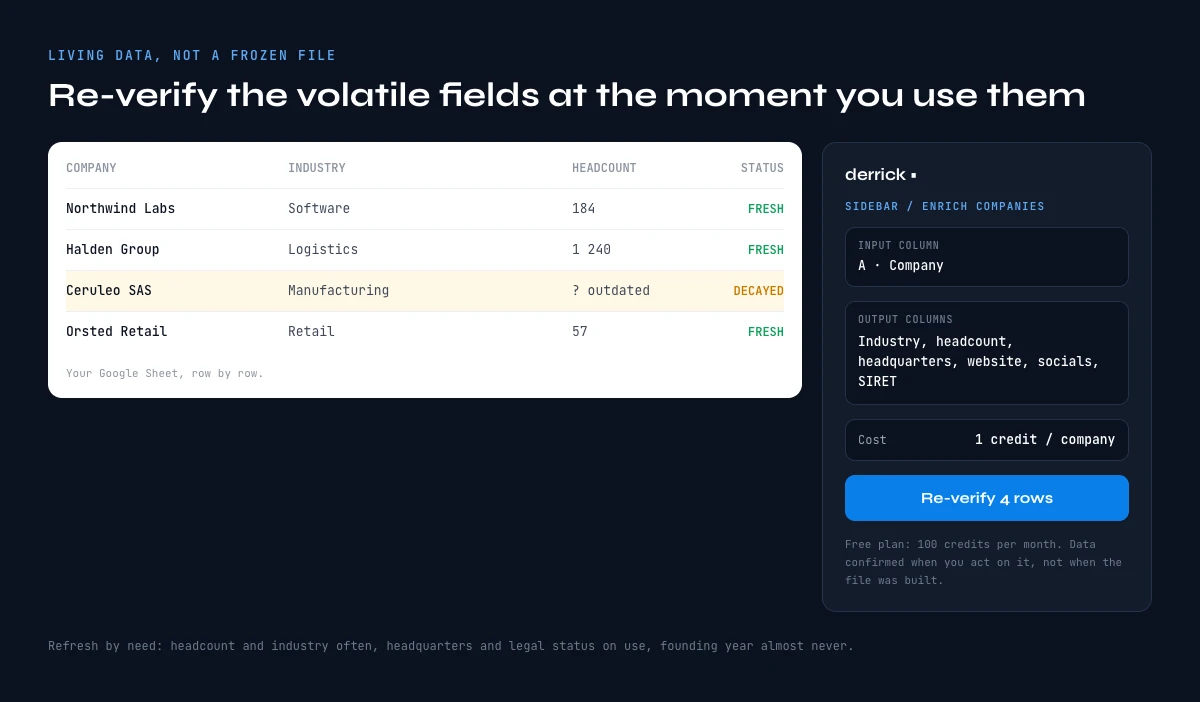
Everything above points to one conclusion: company data should be treated as living, not frozen. Buying a static firmographic stock and trusting it for a year is fighting the decay rate; re-verifying an attribute at the moment you use it is working with it. A recommended refresh cadence follows the per-attribute volatility: re-verify headcount and industry frequently, headquarters and legal status on use, and treat stable fields like founding year as set-and-forget. The point is to refresh by need, not on a calendar, and ideally at the exact moment a record is about to drive a decision.
This is exactly the model Derrick is built for. Rather than selling a static file, Derrick re-verifies and enriches a company on demand, its industry, headquarters, headcount, website, social profiles, and registration identifiers like SIRET, row by row, directly inside Google Sheets, at the moment you need it. The data is confirmed when you act on it rather than when a file was assembled, which mechanically answers the decay problem this report documents. We are not saying static data is worthless; we are saying living data, re-verified on demand, beats a frozen stock on every attribute that actually moves.
Re-verify and enrich your company data on demand with Derrick, free for 100 credits per month, directly in Google Sheets. Start with your most volatile attributes, industry and headcount, then extend the refresh discipline across the file. The website-to-socials angle is covered in the social profiles from website guide, and stable-attribute lookups in the founding year guide.
There is a second-order effect worth naming. Stale firmographics do not just misroute today, they corrupt the historical record you learn from. If the industry or headcount attached to a closed deal was wrong, then the win-rate analysis, the ideal-customer-profile work, and the look-alike modeling built on that history are all subtly off. Bad firmographics therefore degrade not only present execution but the very analysis you would use to improve it, which is how a data problem quietly becomes a strategy problem.
Practically, this argues for verifying at the two moments that matter most: when a record enters the system, and when it is about to drive a high-stakes decision such as scoring, routing, or an outbound touch. Verifying on entry catches data that was already wrong when acquired; verifying at the point of use catches data that has decayed since. Between those checks, the volatile fields do not need constant babysitting, they need to be correct exactly when they are read.
Methodology and sources
This report aggregates primary, tier-one sources: McKinsey on 2025 global M&A deal value and the technology-led rebound; US Census Bureau and Bureau of Labor Statistics work on industry classification and its instability; Gartner on the cost of poor data quality; and the canonical B2B data-decay baseline for the per-month drift rate. Fill-rate and accuracy figures are presented as aggregated ranges drawn from public industry studies, deliberately not attributed to any single data vendor. Where a statistic could only be traced to a data or enrichment vendor's own marketing, we did not use it.
A closing thought for anyone budgeting company data. The instinct is to ask which provider has the best file. The more useful question is how current the data will be at the moment you use it, because the best file in the world is wrong on a quarter of its volatile fields within a year, and a worse file re-verified on demand will beat it where it counts. Stop buying firmographics as a stock to own and start treating them as a flow to refresh, and the decay documented in this report stops being a liability and becomes something you simply manage in stride.
Frequently asked questions
How fast does company data decay?
What causes firmographic data to decay?
What is the difference between coverage and accuracy?
How much does a stale company database cost?
Should I buy a company file or re-verify on demand?
Continue exploring this cluster
Start enriching your sheet in 30 seconds
Free for 100 credits/month. No credit card.
Install Derrick free →