You have a list of target accounts and someone asks the obvious question: how big are they? Revenue is the cleanest proxy for company size, deal potential, and budget, which is why it sits at the center of account scoring and territory planning. The catch is that most companies never publish it.
Here is the honest picture. For public companies and for a subset of registered private companies, the exact figure is filed and free to read. For everyone else, you estimate, and a good estimate is far more useful than a blank cell. This guide walks the full decision tree, the six methods that actually work in 2026, and how to run the whole thing across a spreadsheet instead of one account at a time.
Revenue, turnover, ARR: know what you are looking for
Before you hunt for a number, be clear on which number. The words are not interchangeable across borders and reporting styles, and mixing them up produces estimates that are wrong by an order of magnitude.
- Revenue is the total income a business earns from its normal activity over a period, before any costs are subtracted. In the United States this is the top line of the income statement.
- Turnover is the same concept under British and European reporting. When you read UK or French filings, turnover is the figure you want.
- ARR (annual recurring revenue) is a subscription metric, not a legal one. A SaaS company might quote ARR publicly while its filed revenue differs because of services, one-off fees, or timing. Treat ARR as a signal, not as audited revenue.
One more distinction: reported (a figure a company or registry has published) versus estimated (a figure you calculate from proxies). Always tag which one you have. A sales team that treats an estimate as gospel will misqualify accounts, and a team that ignores a filed figure is leaving free precision on the table.
Why bother at all? Revenue is the single field that lets you size a deal before you spend a call on it. It sets your account tiers, it decides who gets a personal sequence versus a nurture email, and it keeps your reps focused on the accounts that can actually afford you. A rough band is enough for that job. You are not auditing the company, you are ranking it against the rest of your list.
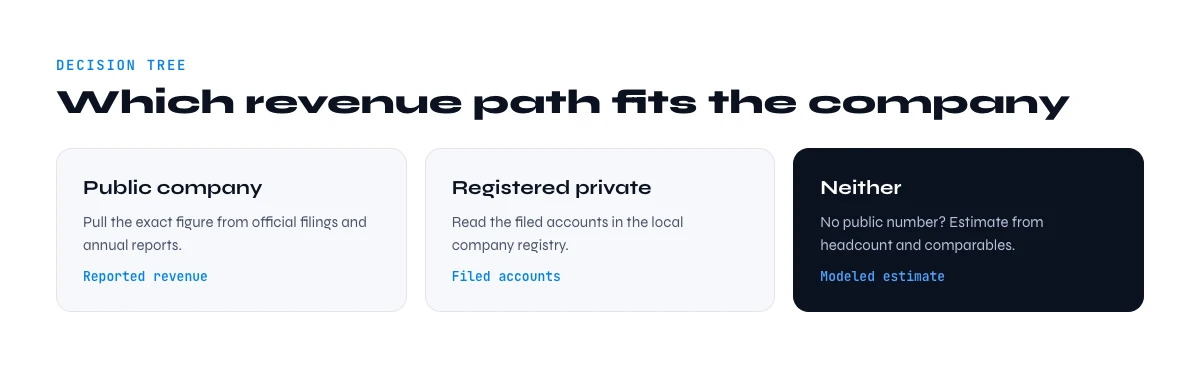
The decision tree: public, registered, or neither
Every company falls into one of three buckets, and the bucket decides your method. Run this check first and you save hours.
- Is it publicly traded? If yes, the exact revenue is in mandatory filings. Go to Method 1.
- Is it registered in a country that publishes filed accounts? France, the UK, and much of the EU require companies to deposit accounts that include turnover. Go to Method 2.
- Neither? A private US company, a small firm that files abridged accounts, or a startup that keeps numbers quiet. You estimate. Go to Methods 3 and 4.
Most B2B prospecting lists are a mix of all three, which is why the scale workflow in Part 08 matters: you want a process that applies the right method per row automatically instead of eyeballing each one.
Method 1: public companies (SEC EDGAR and annual reports)
Public companies are the easy case. They are legally required to report revenue, and the reports are free.
- SEC EDGAR holds every filing for US-listed companies. The annual 10-K and quarterly 10-Q state revenue on the income statement. Search the company name, open the latest 10-K, and read the top line.
- Investor relations pages republish the same numbers in a friendlier format, usually as a press release and an earnings deck.
- Non-US exchanges have equivalents: annual reports for London, Euronext, and Frankfurt-listed firms carry the same figure under turnover or revenue.
Accuracy here is as high as it gets, because the numbers are audited. The only judgement call is the reporting period: make sure you are comparing the same fiscal year across accounts, since year-ends differ. One more shortcut: a public parent often owns private subsidiaries, so if your target is a division of a listed group, the group filing gives you the ceiling even when the subsidiary itself reports nothing.
Method 2: official registries and filed accounts
This is the method most sales teams overlook, and it is where exact figures hide for private companies. Many jurisdictions require companies to deposit annual accounts, and those accounts often include turnover.
- France is the strongest case. Companies file accounts with the commercial court registry (the greffe), and the SIRENE database maintained by INSEE ties every establishment to its SIREN identifier. Filed accounts (comptes deposes) can carry turnover, unless the company opted for confidentiality, which small firms are allowed to do.
- United Kingdom publishes accounts through Companies House. Full accounts show turnover; small companies may file abridged accounts that omit it.
- Rest of the EU runs national registers with varying depth, reachable through the Business Registers Interconnection System.
The practical limit is the confidentiality option: a real filed figure when it exists, and a gap when the company chose to withhold it. That gap is your cue to fall back to estimation. If you work French accounts at volume, pulling the legal and activity layer by SIREN is exactly what a firmographic enrichment workflow is built for.
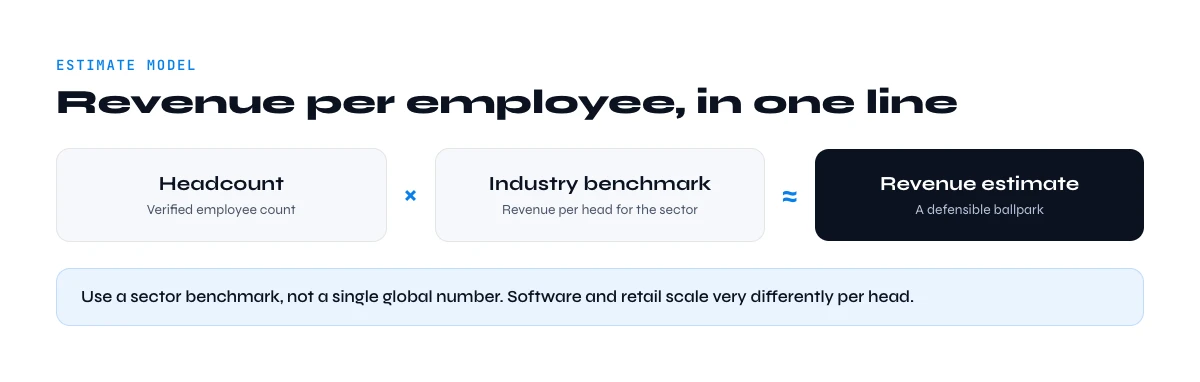
Method 3: estimate with the revenue-per-employee model
When no figure is filed, estimation is the answer, and the most reliable estimator is revenue per employee (RPE). The logic is simple: within an industry, companies need a fairly stable amount of revenue per head to stay viable, so headcount times an industry benchmark gives a defensible range.
The quick rule of thumb is 100,000 dollars of revenue per employee, since a typical employee costs around 50,000 dollars and a 50 percent gross margin means roughly 100,000 dollars of revenue is needed to break even. For early-stage startups, halve it to about 50,000 dollars per employee. Then refine by industry:
| Sector | Approx. revenue per employee | Note |
|---|---|---|
| Cross-industry average | ~350,000 dollars | Skewed upward by capital-intensive sectors |
| SaaS (private, median) | ~130,000 dollars | Lower for early-stage, higher at scale |
| Healthcare and manufacturing | 150,000 to 250,000 dollars | Steady, labor-heavy |
| Energy | ~800,000 dollars | Highly capital-intensive, few employees |
| Early-stage startup (generic) | ~50,000 dollars | Use headcount x 50k as a floor |
To apply it you need two inputs: an accurate headcount and the right industry. Both are firmographic fields you can pull from a LinkedIn company page, which is why the industry classification step and a clean company location and profile matter before you multiply anything. Estimated revenue equals headcount multiplied by the industry benchmark. Report it as a range, not a single number.
Method 4: comparable public company analysis
RPE benchmarks are averages. You can tighten them by anchoring to a real comparable rather than an industry-wide figure. The move: find a public company in the same sector, read its revenue and headcount from its filing, compute its actual revenue per employee, then apply that ratio to your private target.
A shortcut works when sizes differ cleanly. If your target has roughly a quarter of the comparable's headcount, divide the comparable's revenue by four for a first-pass estimate. The closer the business model and geography, the tighter the estimate. This is where a quick profile of the target and its peers pays off, because you want comparables that genuinely match on model, not just on sector label.
Method 5: company data providers and databases
Various commercial databases aggregate company profiles and attach revenue estimates or ranges (for example a band such as 1 to 10 million). They are convenient for a one-off lookup, with two caveats worth stating plainly.
- For private companies the figure is almost always an estimate, often the same RPE math you can do yourself, wrapped in a paywall.
- Coverage is uneven and data goes stale, so a range from a database still needs a sanity check against headcount and industry.
Use them to cross-check, not as a single source of truth. When the database range and your RPE estimate agree, confidence goes up. When they diverge, dig into why before you trust either.
There is also a cost angle worth naming. Paying per lookup makes sense for a handful of strategic accounts, but it does not scale to a list of hundreds without a real bill. For volume, owning the inputs (headcount and industry) and running the estimate yourself is both cheaper and more transparent, because you can see exactly how each number was produced and refresh it whenever the headcount moves.
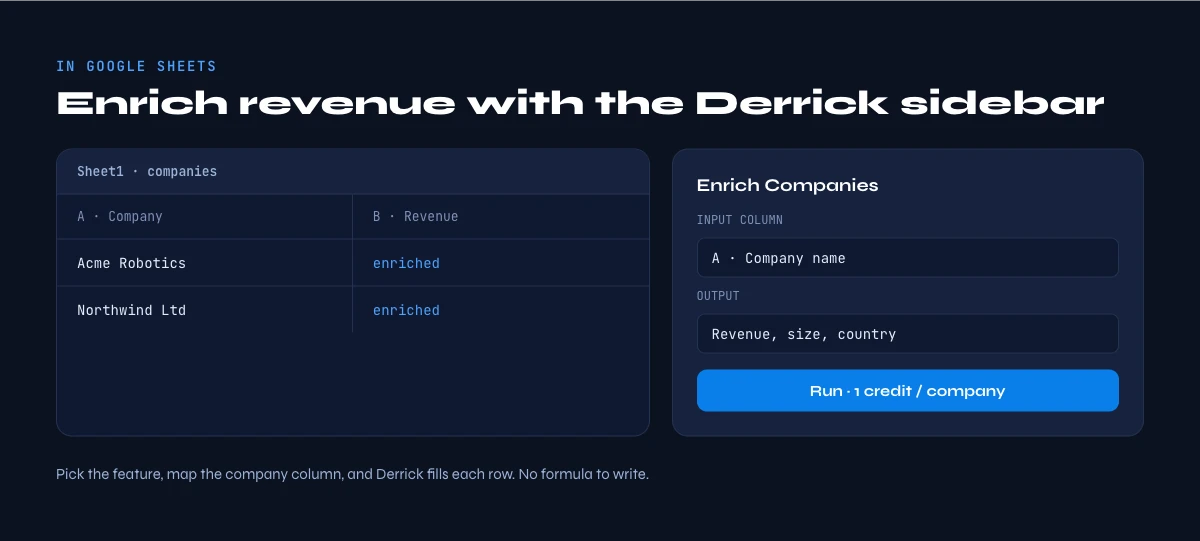
Method 6: do it at scale in Google Sheets
Finding one company's revenue by hand is fine. Doing it for a list of five hundred is where the methods above break down, because you are switching sources per row. The fix is to enrich the inputs in bulk, then apply the right method per row.
Here is the workflow inside a spreadsheet with Derrick:
- Enrich headcount and industry. Paste your company list and run Enrich Companies to pull employee count and industry from each LinkedIn company page. That gives you the two inputs the RPE model needs, for every row at once. Enrich Companies costs 1 credit per company, and the free plan includes 100 credits per month, so you can enrich 100 companies before paying anything.
- Add filed data for French accounts. For French companies, SIRET / SIREN enrichment returns the legal and activity layer tied to the SIREN, so you can flag the rows where an official filing exists rather than estimating them.
- Build comparables. Use Find Similar Companies to pull a peer set for any account, which is exactly what Method 4 needs for a tighter ratio.
- Compute the estimate per row. With headcount and industry in columns, a single spreadsheet formula multiplies headcount by your benchmark and returns an estimated revenue range for the whole list. A simple version looks like headcount times a lookup of the industry benchmark, wrapped so a missing headcount returns blank instead of a false zero.
The order matters. Enrich first so every row has clean inputs, flag the rows with filed accounts so you never estimate a number you could have read, then estimate the remainder. Done this way, a five-hundred-row list goes from empty to fully banded in the time it used to take to research a dozen accounts by hand.
One honesty note that matters for your data hygiene: Derrick does not invent a revenue field out of thin air, and neither should you. LinkedIn company pages do not display revenue, so no enrichment tool can read it from there. What Derrick gives you is the reliable firmographic layer, headcount and industry and the French legal record, that turns guesswork into a structured, repeatable estimate. Derrick scales the same way whether you are estimating ten companies or ten thousand.
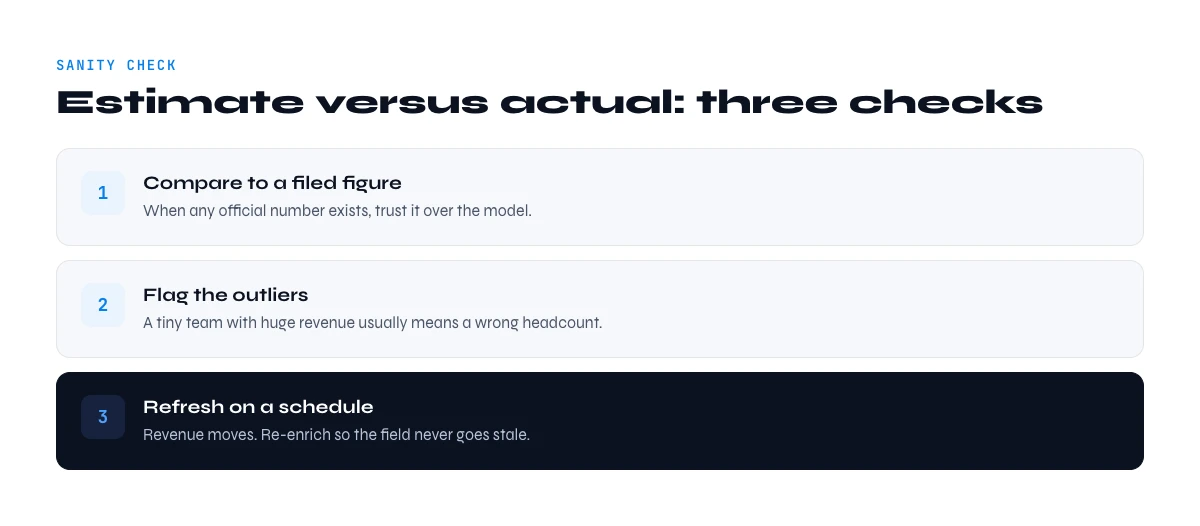
Accuracy: estimate versus actual, and how to sanity-check
Whatever method you use, close the loop with a few checks so a bad number never reaches your CRM.
- Tag the source. Filed, database estimate, or RPE estimate. Never let the three blur together.
- Cross-check two methods. If an RPE estimate and a database range roughly agree, trust it. If they disagree by more than 2x, investigate before acting.
- Watch for outliers. A holding company, a heavily automated business, or a firm with contractors instead of employees will break the RPE assumption. Flag them.
- Refresh. Headcount changes, and so does the estimate. A figure from last year may already be off, which is the whole point of enriching on demand rather than buying a frozen list.
Get the decision tree right, use filings where they exist, estimate cleanly everywhere else, and run it at scale, and company revenue stops being a blank cell and becomes a segmentation lever you can actually act on.
Frequently asked questions
Can you find the exact revenue of a private company?
Where is a French company's turnover filed?
How accurate is a revenue-per-employee estimate?
What is a good revenue per employee?
Is company revenue shown on LinkedIn?
How do I find revenue for a whole list of companies?
Continue exploring this cluster
Start enriching your sheet in 30 seconds
Free for 100 credits/month. No credit card.
Install Derrick free →