A company's industry on LinkedIn is the single fixed category the company selects from LinkedIn's closed taxonomy, a label like "Software Development" or "Financial Services" shown in the About tab. It is the fastest firmographic to segment on, and unlike free text it is consistent across every company page. This guide shows you where to find it, why it matters for B2B, and how to collect it for a whole list of companies instead of one page at a time.
What the LinkedIn industry field is (and what it is not)
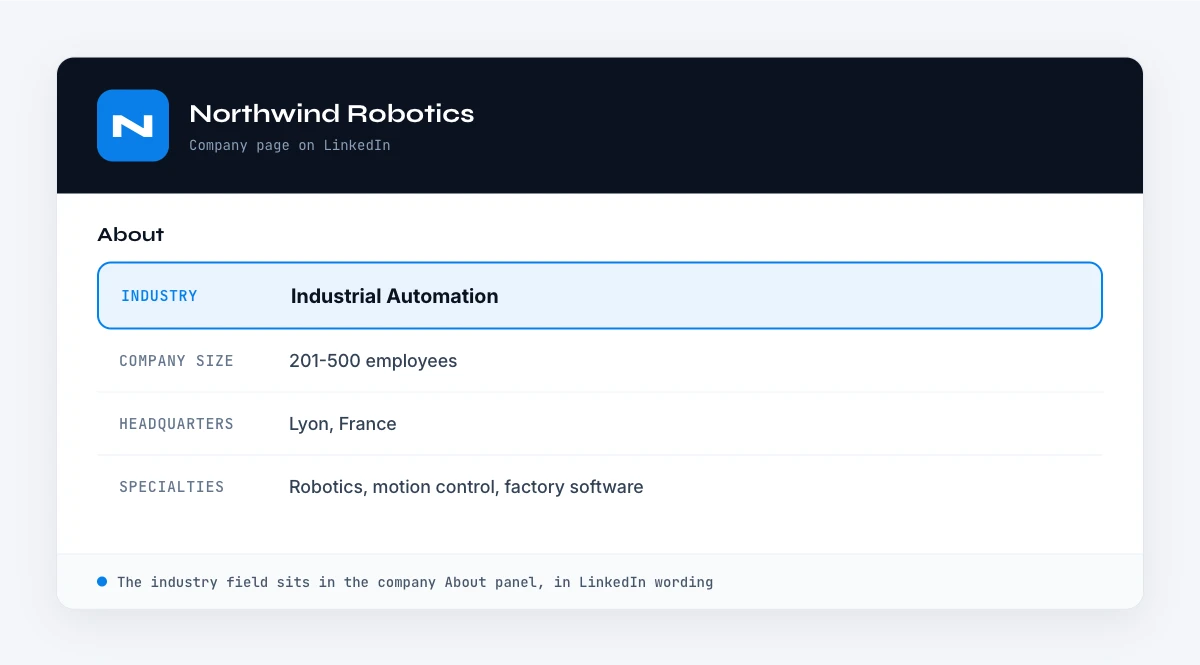
On a LinkedIn company page, the industry lives in the About tab, on its own row next to headquarters, company size and founded year. It is a single value the company picks when it sets up its page, chosen from a closed taxonomy that LinkedIn maintains. In 2022 LinkedIn expanded that list to a richer two level structure, with broad groups like "Technology, Information and Media" sitting above more specific labels like "Software Development" or "IT Services and IT Consulting". A company sees the full list and selects the one that fits best.
Three properties make the industry behave very differently from the other company fields:
- It is fixed, not free text. Every company chooses from the same list, so the values are consistent and easy to group. That is the opposite of the company description, which is prose the company writes itself.
- It is one value per company. A business that does several things still picks a single primary industry. The nuance lives elsewhere, in the Specialties keyword list.
- It is self selected. No one audits the choice, so a company can sit in a category that does not quite match what it actually sells.
A concrete example. A payroll software vendor might select "Software Development" as its industry, list "HR, payroll, compliance, SaaS" under Specialties, and describe itself in the About paragraph as "the payroll platform for European scale ups". The industry gives you the broad bucket, the specialties give you the keywords, and the description gives you the positioning. Each answers a different question.
It is also worth separating the LinkedIn industry from the SIC and NAICS codes you may know from data providers. Those are government standards. LinkedIn uses its own taxonomy instead, so the label you read on a page is LinkedIn's category, not a NAICS code. You can map between the two, but they are not the same system.
Where to find a company's industry manually
For a single company, the industry is two clicks away.
1. The LinkedIn company page
- Search the company name in the LinkedIn search bar, then filter by Companies.
- Open the company page and click the About tab.
- Read the Industry row, listed alongside company size, headquarters and founded year.
If you only have an email or a domain rather than a clean company name, you first need to resolve the company itself. Our walkthrough on how to find a company's details from LinkedIn covers that lookup, and the same About tab that shows employee count shows the industry.
2. The company header and search filters
The industry sometimes appears under the company name in the page header, and it is also the field behind LinkedIn's "Industry" search filter when you browse companies. That filter is handy for discovery, but it does not give you a clean exportable value next to each account, which is the part that matters once you are working a list.
A note on accuracy
Because the industry is self selected and rarely revisited, treat it as a strong hint rather than ground truth. A consultancy might sit in "Management Consulting" while half its revenue is software, and a young company may have never changed the category it picked on day one. When the label looks off, cross check it against the description and the company website before you act on it.
Why the industry is worth collecting for B2B
The industry is the workhorse firmographic. It is coarse, but that is exactly what makes it useful for the jobs below.
Market sizing and segmentation
Example: Sofia runs marketing ops and needs to size the addressable market inside a list of 5,000 companies. With an industry column she can group the list into a handful of verticals in minutes and see where the volume actually sits, instead of guessing from company names.
Routing and territory assignment
Example: A sales team splits accounts by vertical so reps build real expertise. With each company's industry in a column, the ops lead can route fintech accounts to one pod and healthcare to another with a simple filter, rather than reading pages one by one.
Reporting and dashboards
Because the industry is a fixed category, it aggregates cleanly. Pipeline by industry, win rate by industry, and average deal size by vertical are all easy to chart once the field is consistent across your records. Free text never aggregates this neatly.
A first pass ICP filter
Industry is the right tool for a broad first cut, not the final word. Filter a raw list down to the three or four industries that fit your ICP, then layer finer signals like employee count and the description on top. Used that way it removes the obvious misfits cheaply before you spend effort on the rest.
The manual method and where it breaks
For a handful of accounts, opening the About tab and noting the industry is fine. The method has a hard ceiling though, and it shows up fast:
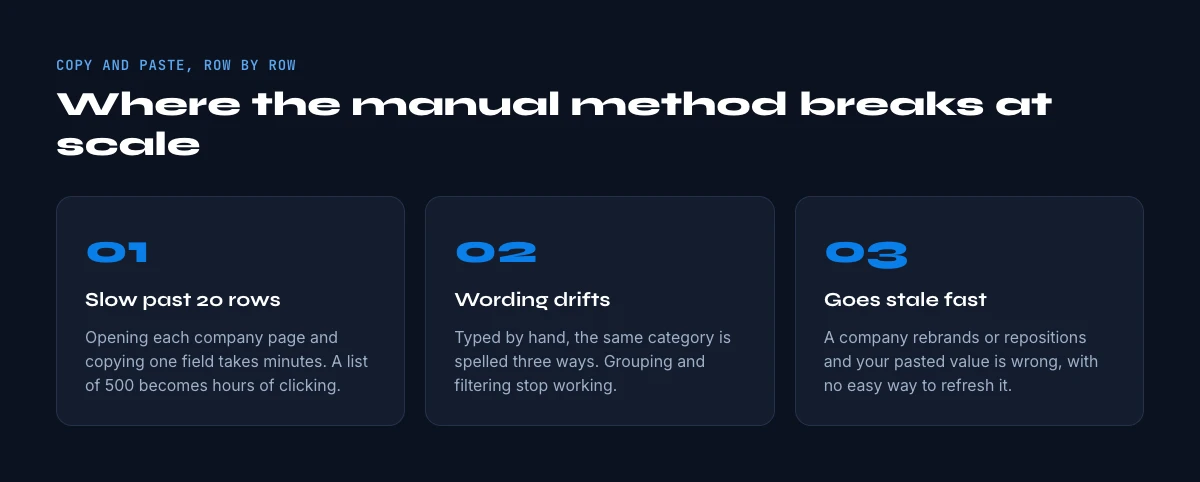
- It does not scale. Opening each page and reading one row takes a minute or so. For 1,000 accounts that is days of repetitive clicking.
- It drifts out of date. A company can change its industry, and a value you noted last quarter has no way to refresh itself.
- It is inconsistent to normalize. When several people collect by hand, the same vertical gets typed five different ways, which breaks the very aggregation the industry is good for.
The hidden cost. Marco leads RevOps and costs his team's time in hours. When he prices out "look up and tag the industry for 2,000 accounts" honestly, it is several days of an analyst's week, and the moment a company updates its page the work is stale. That math is why many teams either skip the field or buy a coarse third party version of it. Collecting it directly, in a consistent format, is what makes it dependable enough to route and report on.
The moment your list grows past a page or two, you want the industry to arrive in your spreadsheet automatically, in the same format on every row, beside the other attributes you already track.
How to extract company industries at scale with Derrick
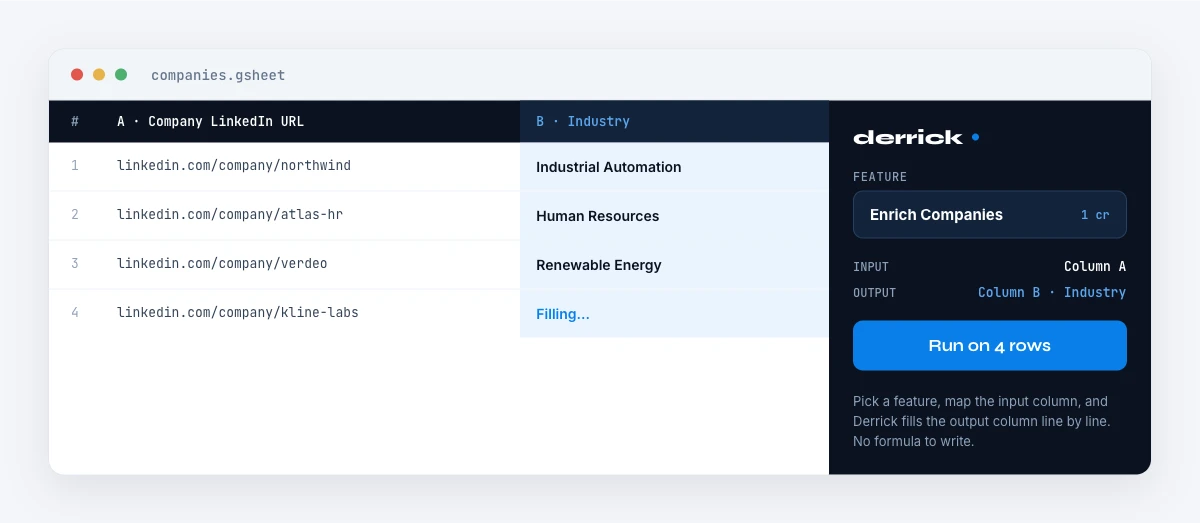
Derrick is a Google Sheets sidebar, not a set of spreadsheet formulas. You work from a normal sheet, select your rows, and Derrick fills the columns you ask for. For company industries the path is short:
- Start from a list of companies. If you already have LinkedIn company URLs, you are ready. If you only have names, use Search Companies to resolve each name to its LinkedIn URL first (a free and paid feature, 1 credit per company).
- Run Enrich Companies. The Enrich Companies feature pulls all available information from a company's LinkedIn page, including the industry, company size, description, specialties and headquarters, into your sheet. It costs 1 credit per company and is available on the free and paid plans.
- Read the industry column. The category lands in its own column, in LinkedIn's own wording, ready to group, filter or route on.
Because everything stays in the sheet, the industry sits right beside the other firmographics you collect: the follower count, the company description, and the company size. One pass, one consistent format, refreshable whenever you re run it.
A note on hygiene. Two habits keep an industry column clean. First, deduplicate by company before you enrich, so you do not spend credits pulling the same account twice. Second, expect a few blanks: some pages leave the industry unset, and a missing value is itself a signal to fall back to the website. Plan to normalize LinkedIn's labels into your own segment names once, rather than working with 150 raw categories forever.
Derrick works the same way for a 20 row test and a 20,000 row list. The free plan gives you 100 credits per month to try it on a real sample before you scale up. Nothing about the workflow changes between a quick experiment and a full database refresh, which is what makes it safe to start small and grow into.
Industry vs the other company fields: which to use when
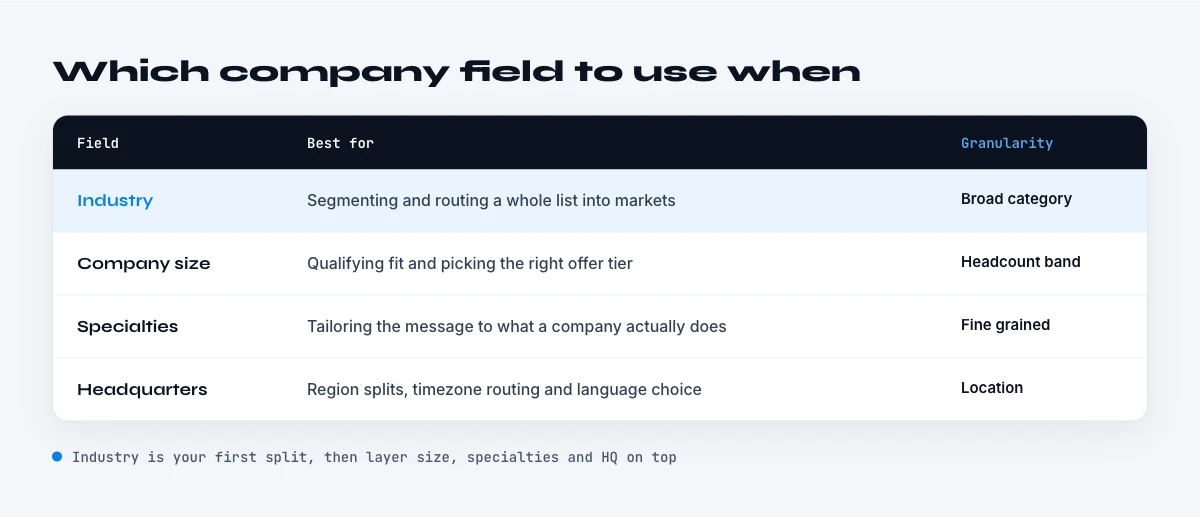
The industry is one signal among several. Here is how it compares with the neighbouring fields, so you collect the right mix rather than everything by reflex.
| Field | Format | Best for |
|---|---|---|
| Industry | Fixed category | Segmentation, routing, reporting, TAM sizing |
| Description / About | Free text, multi sentence | Personalization, keyword scoring, qualification |
| Specialties | Comma separated keywords | Filtering by focus area, tagging |
| Employee count | Number or range | Sizing, ICP fit, routing |
| Tagline | One short line | Fast positioning scan, email hooks |
In practice the industry plus the company size give you a fast two dimensional segmentation, and the description adds the human detail when you move from sorting accounts to writing to them. A useful rule of thumb: use the fixed fields (industry, size) for grouping and routing, and the free-text fields (description, tagline) for the message itself. You rarely need every field on every row, and pulling only what a play uses keeps both your sheet and your credit spend lean.
Turning industry data into action
Once the industries are in your sheet, the leverage comes from shaping them to fit how you actually sell.
- Map to your own segments. LinkedIn's 150 plus categories are finer than most go to market motions need. You can ask an AI step to collapse each raw industry into your own short list of verticals using Ask Claude right in the sheet (a paid feature, 2 credits per line), so "Software Development", "IT Services" and "Internet" all roll up to your single "Tech" segment.
- Build a TAM view. With a clean segment column, a pivot gives you account counts per vertical in seconds, which is the start of any market sizing exercise.
- Route and score. Combine the segment with the company size to assign accounts to the right pod and to give each one a first fit score before a human ever looks at it.
That is the real payoff. The industry stops being a label you glance at and becomes a structured input your routing, reporting and scoring can all run on.
A simple end to end flow looks like this: resolve company names to LinkedIn URLs, enrich to pull the industry and size, normalize the industry into your own segments, then pivot or route from there. Every step happens in the same spreadsheet, so there is no export and re import, and you can rerun the whole chain next month to refresh.
For the wider picture on how reliable LinkedIn's firmographic layer actually is, and when to re verify it, see our State of LinkedIn Company Data 2026 report.
Frequently asked questions
Where do you find a company's industry on LinkedIn?
Is the LinkedIn industry free text or a fixed list?
Can a company have more than one industry on LinkedIn?
How is the LinkedIn industry different from SIC or NAICS codes?
How do you get the industry for a whole list of companies?
Why is a company's LinkedIn industry sometimes wrong?
Continue exploring this cluster
Start enriching your sheet in 30 seconds
Free for 100 credits/month. No credit card.
Install Derrick free →