
What Are Impressions on LinkedIn
What does impressions mean on LinkedIn? Learn how displays are counted, what a good number is for your audience, and how to reach the right people.


What are impressions on LinkedIn: the short answer
What are impressions on LinkedIn? An impression is counted every time your content is displayed on somebody's screen, whether or not that person reads it, likes it or clicks anything. It is a display count, not a people count. If the same person scrolls past your post three times in a day, that is three impressions and one human being.
So when the platform shows you that number, what it means is displays. That single distinction explains almost every confusing thing about the metric. A post with 4,000 impressions has not reached 4,000 people. It has been rendered 4,000 times to a smaller group, and LinkedIn tells you the size of that group under a different label: members reached. Divide one by the other and you get frequency, the average number of times each person saw the thing.
LinkedIn impressions meaning, in plain terms
In plain terms, one impression is one display of the content. So if you are asking what a LinkedIn impression is, the honest answer is an event on a screen rather than a person in an audience. And what are LinkedIn impressions, added up? A count of screens, not a headcount. What follows from that is rarely written down. Impressions are anonymous by construction. LinkedIn will tell you how many times your post appeared, and it will describe the crowd in aggregate, by job title, company and location. It will never hand you the list of names. That is not an oversight, and no tool changes it. The only people a post lets you identify are the ones who did something visible, and this guide ends on how to turn that smaller, named group into a list you can actually work. If you only want the mechanic, Import LinkedIn post likes & comments is the step that turns a post into that named list, and it runs on the free plan.
How LinkedIn decides that an impression happened
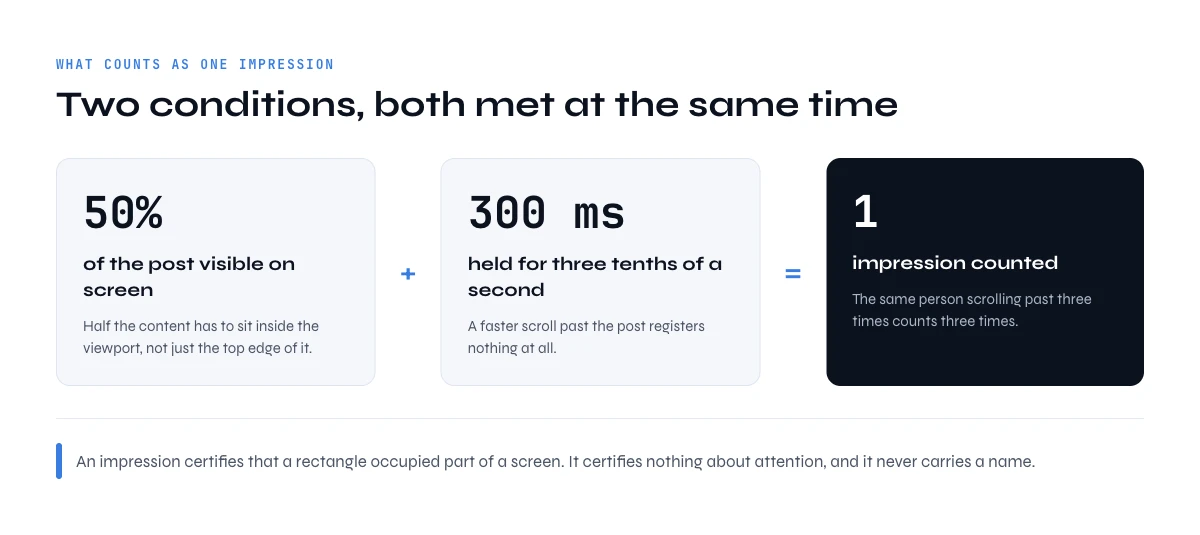
An impression is not registered the moment your post exists. It is registered when the post is rendered in a viewport under a measurable condition. LinkedIn spells that condition out in its own help page on content analytics: a view counts when the content is at least 50 percent on the screen for 300 milliseconds or more, or when it is clicked. Three tenths of a second, and half the post on screen. Below that, the scroll does not count, unless the person clicks.
Sponsored content follows a slightly stricter rule on desktop. LinkedIn's viewability page for ads sets it at 50 percent of the ad in view for one full second on a computer, and 300 milliseconds on mobile. So a paid impression on desktop asks a little more of the viewer than an organic one.
One detail surprises most people: your own views count. LinkedIn's post analytics help says that your own views, engagements, saves and sends are counted towards the analytics of your content. Open your post ten times to check the comments and you have added ten impressions yourself. On a small account that is not noise, it is a visible share of the total.
Two consequences follow, and both are worth internalizing before you read any benchmark.
First, an impression is a very low bar. It certifies that a rectangle occupied part of a screen for a third of a second. It does not certify attention, comprehension, or that a human was even looking at the device. Anybody presenting the number as evidence of message delivery is overselling it.
Second, the threshold is why format changes the count so much. A post that opens with an image or a video occupies more vertical space, which means it clears the fifty percent visibility rule faster and holds it longer as the reader scrolls. That fact about the threshold, not some mystical algorithm preference, is a large part of why visual posts routinely show higher impression counts than a wall of text.
What are impressions on LinkedIn vs members reached, reach and views?
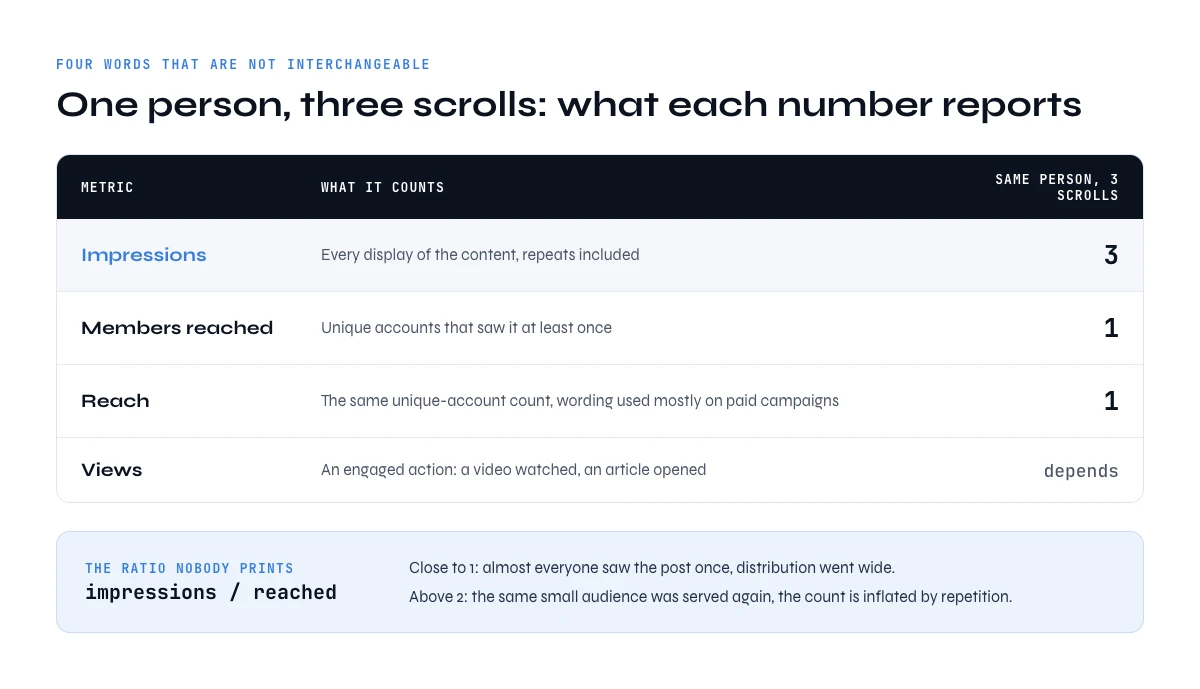
LinkedIn uses several words that sound interchangeable and are not. Getting them straight takes thirty seconds and saves you from reporting a number that means something else.
| Metric | What it counts | Same person, three scrolls |
|---|---|---|
| Impressions | Every display of the content, repeats included | 3 |
| Members reached | Unique accounts that saw it at least once | 1 |
| Reach | The unique-account count, wording used mostly on paid campaigns | 1 |
| Views | An engaged action: a video watched, an article opened | Depends on the action |
| Engagements | Reactions, comments, reposts and clicks: the only row that carries names | 0, unless they react |
Frequency is the ratio you never see printed but should compute yourself: impressions divided by members reached. A frequency near 1 means almost everybody who saw the post saw it once, so distribution went wide. A frequency above 2 means the platform kept re-serving the same small audience, and your impression count is inflated by repetition rather than by reach. Two posts at 3,000 impressions, one at frequency 1.1 and one at frequency 2.6, are not the same event at all.
You will also meet the label unique impressions, mostly in company page reports. Read it as a people count, the same idea as members reached: distinct accounts, repeat displays excluded. If a report shows both impressions and unique impressions, the ratio between the two is your frequency again.
Impressions and engagement rate
Engagement rate is the one ratio LinkedIn does print. Its help pages define it as interactions divided by impressions, where interactions are clicks, reactions, comments and shares. That makes impressions the denominator of every engagement rate you have ever seen for a post. Two things follow. A post can raise its engagement rate simply by being shown less, so never read the rate without the count next to it. And the numerator is the interesting part for anybody who sells: engagements are the slice of LinkedIn impressions that comes with a name attached, which is exactly where this guide ends up.
All of these sit in the profile analytics surface covered by our guide to optimizing a LinkedIn sales profile. Profile views are a fifth number and a separate system entirely. They count people who opened your profile, and LinkedIn does name some of them, which is one of the few identity signals the platform sells. How much of that list you see depends on your subscription tier, a question we cover in the break-even test for LinkedIn Premium.
What are impressions on LinkedIn made of? Organic, paid and viral
The same word covers three different mechanics, and mixing them makes month-over-month comparison meaningless.
Organic impressions
They come from unpaid distribution: your followers, your connections, and the people the feed decides to show you to. They are free, they compound with a posting habit, and they are the only ones that reflect whether your content earns its own distribution.
Paid impressions
They come from sponsored content. You buy them, so the volume is a function of budget and targeting rather than of quality. A campaign can print a large impression number and teach you nothing about whether the message works, which is why paid reporting should always be read next to a downstream metric.
Viral impressions
They come from reshares and from the second-degree exposure that follows engagement: somebody comments, and the post surfaces in their network. This is the category that produces the outlier weeks, and it is also the least controllable.
Do reposts count as impressions on the original post? LinkedIn's help pages count reposts as their own number, the times people shared your post to their feed, and they do not spell out how the views of a repost roll into your original total. So do not assume either way: open the detail of the post and check what is broken out there before you credit a spike to your own content or to somebody else's share.
Report them separately or do not report them at all. A month where paid spend doubled is not a month where your content improved, and a quarter carried by one viral post is not a repeatable baseline.
What is a good number of impressions on LinkedIn?
A good number of impressions on LinkedIn is a ratio, not a count. Absolute impression counts are close to useless as a benchmark because they scale with audience size. A post at 500 impressions is excellent for an account with 800 followers and a warning sign for an account with 20,000. The number that travels is the ratio.
The usable band, the one most published benchmark sets converge on, is 10 to 30 percent of your follower count per post for organic distribution. Treat it as a convention to sanity-check against, not as a measurement of your niche. Under 10 percent, the feed is not carrying the post beyond a small slice of your own network. Over 30 percent, something pushed it past your immediate circle, which is the signature of reshares and comment-driven exposure.
| Followers | Weak | Normal band | Carried beyond your network |
|---|---|---|---|
| 1,000 | under 100 | 100 to 300 | over 300 |
| 5,000 | under 500 | 500 to 1,500 | over 1,500 |
| 20,000 | under 2,000 | 2,000 to 6,000 | over 6,000 |
Average impressions on LinkedIn are commonly put at around 800 per post, a figure widely cited for 2024 and up from roughly 700 the year before in the benchmark sets that publish it. Treat it as trivia. It aggregates accounts with 200 followers and accounts with 200,000, so it describes nobody. Your own trailing median over the last twenty posts is a far better reference, and it is the only one that accounts for your audience, your niche and your posting rhythm.
To compute the ratio you need the denominator, and follower counts are not something you want to read off a screen one profile at a time. LinkedIn Followers & Connections Count returns it for a column of profile URLs at 1 credit per profile, on the free plan as well, which is how you benchmark a whole team rather than one account.
The app works through your list row by row. 100 free credits every month.
Where to see your impressions, post by post
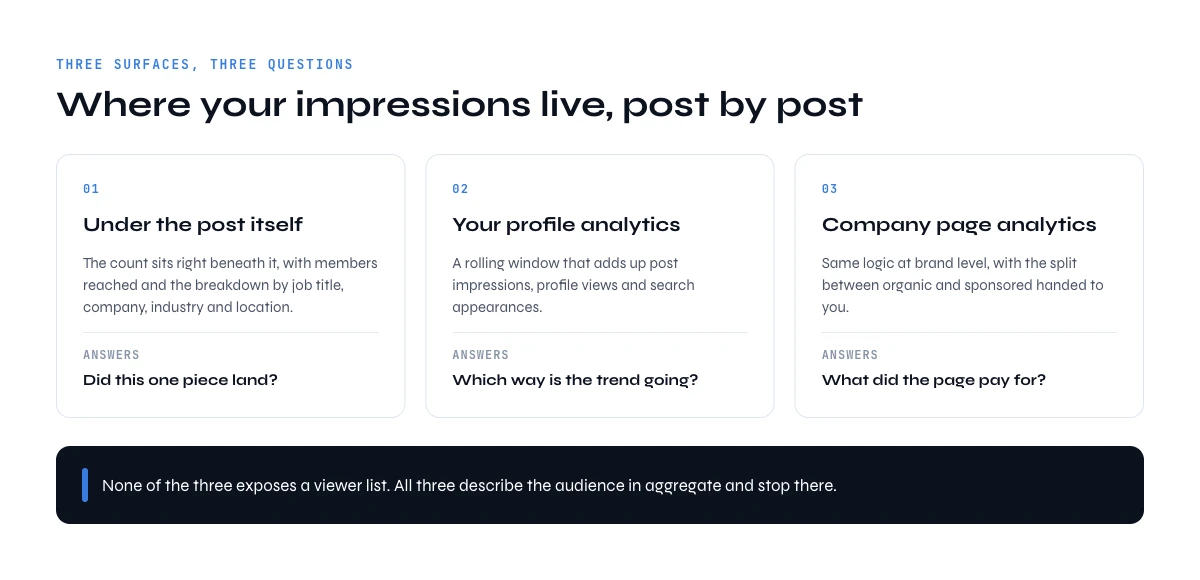
If you are wondering how to see impressions on LinkedIn, there are three places for posts, and they answer three different questions. Comments have a fourth counter of their own.
Post impressions on LinkedIn: under an individual post
Open the post from your own feed or profile and the impression count sits directly beneath it, with a link into the detail: members reached, the aggregate breakdown of who saw it by job title, company, industry and location, and the engagement counts. This is the view to use when you want to know whether one specific piece landed.
In your profile analytics
The analytics section of your own profile rolls up post impressions over a rolling window, alongside profile views and search appearances. Use it for trend, never for a single post, because a rollup hides the distribution: five quiet posts and one outlier average out to a comfortable lie.
In company page analytics
Page admins get the same logic at brand level, with impressions split by organic and sponsored. This is where the organic and paid separation is handed to you rather than reconstructed.
Comment impressions
Comments now carry their own impression count. According to LinkedIn's help page on comment analytics, a comment impression is counted each time someone views your comment, it is not unique (the same member viewing twice counts twice), and your own views are included. Only you can see it, except that Page admins see the count for comments made as the Page. It shows next to the comment in the feed or in a group, and it is not shown in any dashboard, so there is no rollup to export.
None of these places exposes a viewer list. All of them describe the audience in aggregate, or not at all, and stop there.
How to increase impressions on LinkedIn (and reach the right people)
Most advice on how to get more impressions on LinkedIn treats the count as the goal. It is a means. The test for every lever below is the same two numbers: did the impression to follower ratio go up, and did the share of engagers who match your ICP hold or rise? A lever that lifts the first and sinks the second has bought you a bigger room full of the wrong people.
Use formats that occupy the screen
The counting rule rewards height. An image, a document carousel or a short video takes more of the viewport than three lines of text, so it crosses the 50 percent line sooner and stays above it longer while people scroll. That is mechanics, not taste. Use it on the posts that carry your real topic, not on filler.
Post on a rhythm you can hold
Organic LinkedIn impressions compound with a habit. Two or three posts a week, every week, does more for the ratio than a burst of daily posting followed by a month of silence, because your followers learn to expect you and the feed has recent signals to work with. Pick the rhythm you can keep for a quarter, then judge it on your trailing median, never on one post.
Answer comments in the first hour
Comments are the engagement that travels: each one can surface the post in the commenter's network, which is where viral impressions come from. Replying quickly keeps the thread alive and adds to it. It also raises your engagement rate the honest way, with real conversations rather than with engagement bait, and every reply is a named person you can come back to.
Keep external links out of the post body
A link in the post invites people to leave the feed, and many creators report lower reach on those posts. Put the post's value in the post itself and move the link to the first comment, or leave it out. Measure it on your own account before you make it a rule: compare your ratio on posts with and without a link over a few weeks.
Repeat the topics that already beat your median
Your best predictor is your own history. Sort your last twenty posts by impression to follower ratio and look at the top five. If they share a topic or a format, that is your next post. Then check who engaged on them, which is the part most guides skip: a topic that pulls a big crowd of students and job seekers is a reach win and a pipeline zero. Building visibility with buyers is also one of the pillars measured by the LinkedIn Social Selling Index, which makes it a useful second check.
Why your LinkedIn impressions go down
The usual causes are few. Your rhythm slipped. Your follower count grew faster than your reach, so the raw number held while the ratio fell. You switched to formats that take less screen. Your posts carried outbound links. Or one viral post set an expectation the next ten could not meet. Diagnose with the ratio and with frequency, as described in the FAQ below, before you change anything.
A last point that confuses people: impressions often keep climbing for days after you publish. A post keeps being served as people engage, reshare it or comment late, and each of those can show it to a new network. So read a post's numbers after a week, not after an hour, and compare posts at the same age.
What are impressions on LinkedIn not telling you? Who saw your post
This is the part that decides whether the metric is useful to you or not.
An impression has no identity attached to it. LinkedIn records that content was displayed, aggregates the audience into demographic buckets, and publishes those buckets. It does not publish the individual accounts, it does not expose them through any API tier, and it does not sell them at any subscription level. A post with 12,000 impressions gives you exactly zero names.
This is why impressions are so often called a vanity metric, and why that label is slightly unfair. The number is real and it measures something real. The problem is that it is terminal: there is no next action attached to it. You cannot follow up with an impression, segment it, or put it in a sequence. It tells you the room was full and refuses to tell you who was in it. The one identity signal the platform does sell is the profile viewer list, which is why the question of whether somebody is on a Premium plan keeps coming back, and why the quotas attached to those plans decide how far you can act on it.
Are LinkedIn impressions real?
Yes, but they are cheap. Three things make the number look inflated. Repeat displays count, so one loyal follower scrolling past four times is four impressions. Your own views count. And the bar is low: half a post on screen for 300 milliseconds is enough, whether anybody read it or not. None of that makes the number false. It measures exactly what LinkedIn says it measures, displays. It just measures something much smaller than attention, which is why it should never be read as a count of readers.
Two consequences for anybody using LinkedIn to find customers. Do not build a pipeline forecast on impression volume, because the relationship between displays and conversations is not something you can observe from your side. And do not optimize a posting strategy purely for the impression count, because you can raise displays with formats and hooks that attract an audience with no reason to ever buy from you. The relevant question is not how large the number is. It is how much of it is named.
The named subset: the only people a post lets you identify
Out of everybody a post reaches, one group is public by design: the people who reacted or commented. Their names and profile URLs sit on the post itself, visible to anyone who opens the reaction list. That subset is small, usually a low single-digit percentage of impressions, and it is qualitatively different from the rest of the audience for one reason. Those people spent something. A like costs a click and a comment costs a sentence, in public, under their own name.
So the honest conversion of an impression count into something workable looks like this:
The orders of magnitude below are there to sanity-check your own numbers against, not as published data. What is not an estimate is the third column.
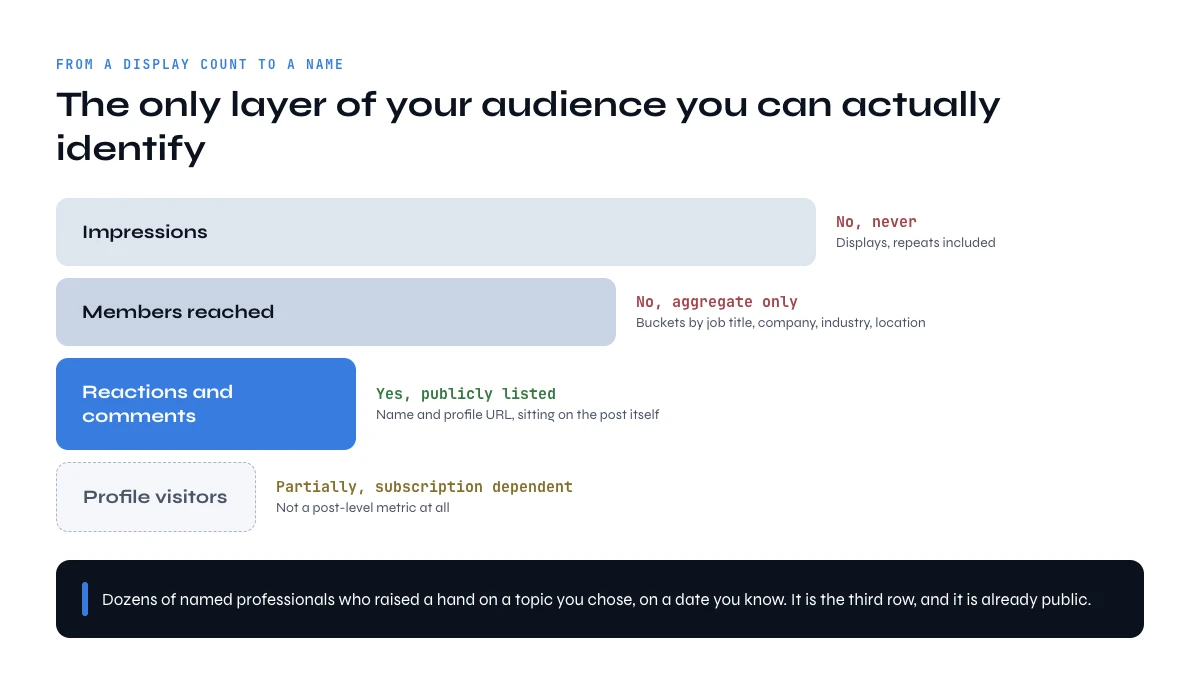
| Layer | Order of magnitude on a 3,000 impression post (illustrative) | Can you name them |
|---|---|---|
| Impressions | 3,000 displays | No, never |
| Members reached | 1,500 to 2,500 accounts | No, aggregate only |
| Reactions and comments | 20 to 90 accounts | Yes, publicly listed |
| Profile visitors | not published as a post-level metric | Partially, subscription dependent |
Read the third row again. On a normal post that is dozens of named professionals who raised a hand on a topic you chose, on a date you know. As an intent signal that is stronger than most of what a paid intent dataset will sell you, and it is sitting in public on your own content. The reason almost nobody uses it is purely operational: copying names off a reaction list by hand is unbearable past the first twenty, and it produces a list with no email, no company and no job title.
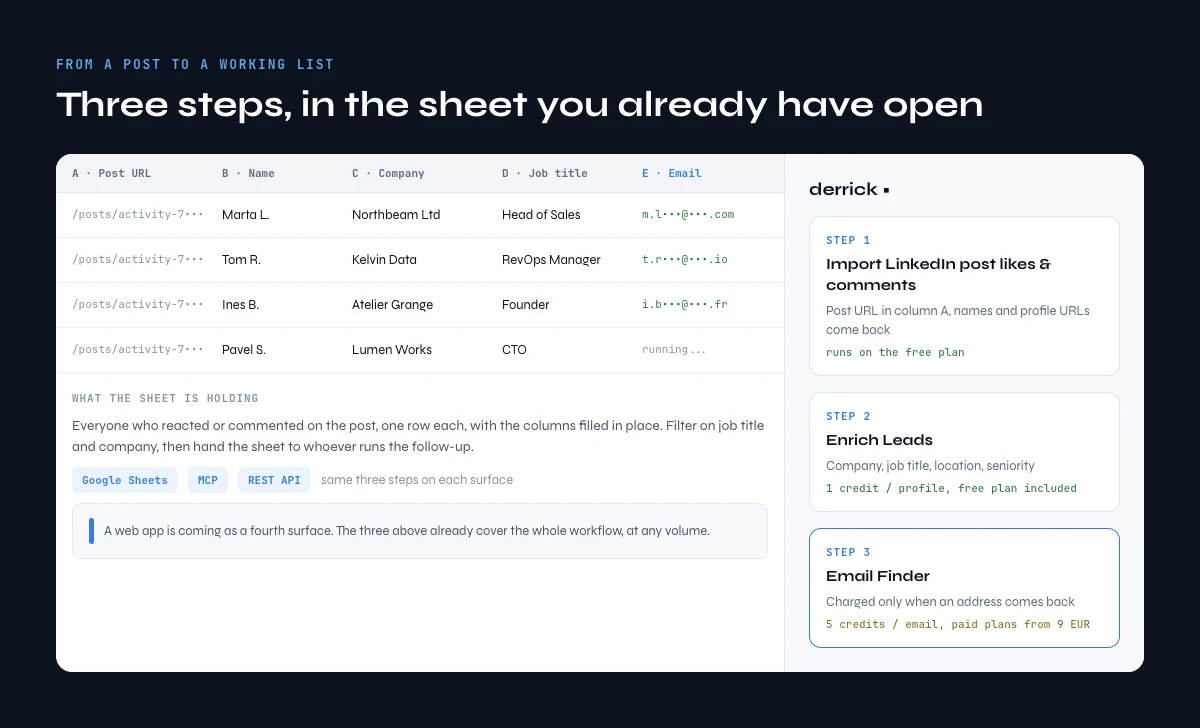
From a post to a working list, on four surfaces
Turning that named subset into something you can work is three steps, and Derrick runs all three in its web app, with Google Sheets, Claude through MCP and the API as other places to run the same steps. Nothing to install to start: open the Derrick web app, paste the post URL, and connect your LinkedIn account once through the Derrick Chrome extension, which is what lets Derrick read the post's reactions and the profiles behind them.
Step one: extract the engagers
Import LinkedIn post likes & comments takes a post URL and returns everyone who liked or commented, with name and profile URL. It costs 1 credit per engager, and only the rows that come back are counted. It runs on the free plan, which is 100 credits a month at zero euros.
Step two: enrich the profiles
Enrich Leads turns those URLs into a real table: current company, job title, location, seniority. It costs 1 credit per profile and it also runs on the free plan. This is the step that separates the twelve people who match your ICP from the eighty who liked the post because the hook was good.
The free plan math, step one plus step two: 1 credit to import a person and 1 credit to enrich them makes 2 credits per qualified person, so 100 free credits a month cover about 50 people. A post with 200 reactions is more than a month of the free plan, which is the point where a paid plan starts to make sense.
Step three: resolve the contact
Email Finder is a paid step at 5 credits per email, and it is charged only when an address actually comes back. Paid plans start at 20 euros a month with Standard.
Pick the surface that matches how you work, because the same three steps run on all of them:
| Surface | What it looks like | When to use it |
|---|---|---|
| Web app | Paste the post URL in app.derrick-app.com, the engagers land in a table, enrichment fills the columns next to them | The default: you want the list in a few clicks, with nothing to set up |
| Google Sheets | A sidebar next to your sheet: paste the post URL, the engagers fill a column, enrichment fills the next ones | You want the list as a spreadsheet you can filter and hand to somebody |
| MCP, in Claude or any MCP client | You ask in plain language for the engagers of a post and get the enriched table back in the conversation | You are already working in a chat and want the answer without switching tools |
| REST API | One call per step, JSON back, wired into your own job | You want this to run every Monday on last week's posts without anybody clicking |
API and MCP access start on the Plus plan at 47.50 euros a month. All four surfaces cover the whole workflow, at any volume: one post after a good week, or every post your team published this quarter.
What are impressions on LinkedIn good for in a sales week
Used honestly, the metric has two jobs and neither of them is being a KPI.
A distribution diagnostic
When impressions fall while your posting rhythm holds, something changed in how the feed treats you, and the ratio to follower count tells you whether the drop is real or just an audience that grew faster than your reach. When frequency climbs above 2, the platform is recycling the same audience and you have a reach problem dressed up as a volume number.
A sampling frame
The posts with unusually high impressions tell you which topics pull a crowd, and the engagers on those posts tell you who that crowd actually is. Run the extraction on your three best posts of the quarter and read the enriched table. If the job titles are not your buyers, your content is working and your targeting is not, which is a completely different problem from the one a low impression count describes.
The practical weekly loop is small: post, check the impression to follower ratio rather than the raw count, extract the engagers on anything above your median, enrich, and keep the rows that match your ICP. Everything else about the number is scoreboard. If you want the profile fields behind those rows, our guides on extracting a job title from a profile URL and finding someone's current company cover the fields one by one, and how to find a LinkedIn URL handles the case where you have the person but not the link.
Frequently asked questions
What does impressions mean on LinkedIn?
Do your own views count as LinkedIn impressions?
What is the difference between impressions and members reached?
Is 1,000 impressions on LinkedIn good?
Can you see who viewed your LinkedIn post?
Why did my LinkedIn impressions drop?
How do you turn LinkedIn impressions into prospects?
What is the difference between impressions and views on LinkedIn?
Keep reading
Continue exploring this cluster


LinkedIn Profile Data Decay Report 2026: How Fast B2B Profile Data Goes Stale
Read →

How to Find a LinkedIn URL: Complete Guide for Professionals and Prospectors
Read →

LinkedIn Headline 2026: Character Limit + Examples That Work
Read →

How to Find Country from LinkedIn Profile URL: 3 Proven Methods
Read →